Association Testing in Unrelated Individuals
In association testing we are interested in the effect of a specific allele in the population. We ask the question: "Is allele X1 more common in affected individuals than unaffected individuals?" We do not need family data to answer this, but we can use it if we have it.
Recall that Linkage Disequilibrium is the tendency for alleles at two loci closely linked on a chromosome to be associated in a population. Linkage is done within a family (referring to alleles inherited together), and LD is done within a population (alleles found at two loci together on a haplotype more often than expected). Two loci are linked when the theta score is less than .5, this does not necessarily mean they are in LD.
After many generations disease causing mutations in LD will change due to recombination.
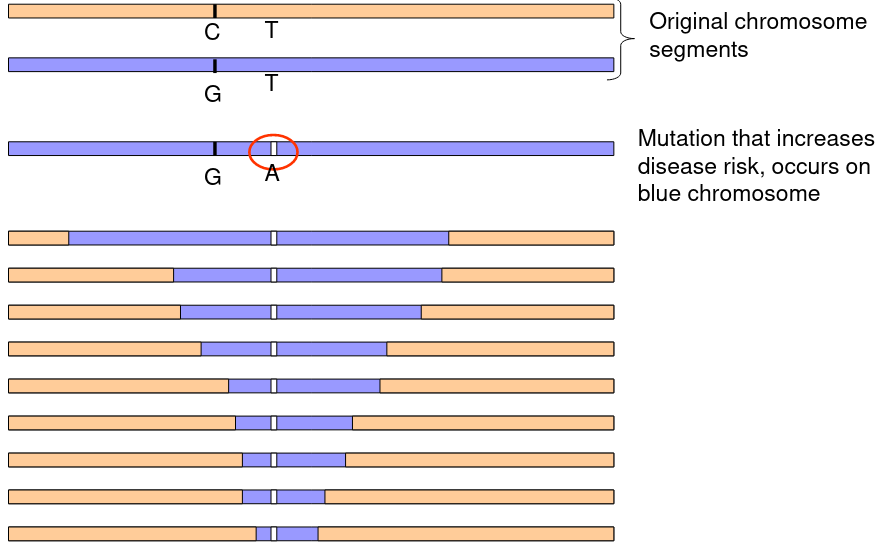
The above graphic represents a mutation on the blue chromosome that over time and recombination through mitosis slowly decreases the LD between the mutation and the surrounding chromosome.
Specific alleles may be functional or in LD with functional mutations.
Functional = casual -> the mutation that actually causes the increased/decreased risk/phenotype.
Genetic Association Testing
In genetic association analysis, we are trying to identify association between genotype (SNP) and phenotypes. Some alleles may be functional or in LD with functional mutations, meaning it's not the "true cause" of a particular phenotype.
functional/casual - the mutation that actually causes the increased/decreased phenotype
H0: No association between marker genotypes and phenotype
When the null hypothesis is rejected, we conclude a marker is associated with a phenotype.
The marker may be a functional mutation or in LD with a functional mutation
- Non-synonymous changes, truncation, UTR SNPs may be more likely to be causal ("functional SNPs")
- Synonymous, intronic, IVS SNPs may be less likely to be casual
- Functional studies are usually required to determined whether an associated SNP is functional/casual
- Databases such as ENCODE make it easier to predict if variants have function but its still difficult to be sure for non-exonic variants
Association Testing for Qualitative Traits
- Can be performed within case-control or cohort/population studies
- Case-control commonly used for genetic studies of rare traits
- H0: there is no association between alleles
- Testing methods:
- Chi-square (or Fishers exact) test comparing allelic or genotypic frequencies between cases and controls
- X2 = sum((Oi - Ei)^2/Ei)
- DF = number of genes compared - 1
- Logistic regression
- Allows incorporation of covariates
- Convenient framework for exploration of genetic models
- For matched case-control studies can perform MH test, conditional logistic regression
- Chi-square (or Fishers exact) test comparing allelic or genotypic frequencies between cases and controls
Logistic Regression
- Best for regression under a dichotomous outcome (affected/unaffected), when linear regression is not appropriate.
- We want the response (dependent variable) Y to have two possible values, 1 for effected or 0 for non-effected.
- A regression equation can predict a number between 0 and 1 that could be interpreted as the probability of being affected or the log odds of being affected.
- Regression coefficients are the log odds ratios for each of the independent variables.
The linear logistic model has the form: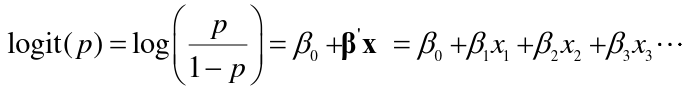
- For a dichotomous predictors the beta parameters in a logistic regression are the log-odds ratios for a disease for those with a risk factor (x = 1) vs those without (x = 0)
- For a continuous or ordinal predictor, the parameters are log-odds ratios for a one unit increase in x.
Coding Genetic Variables
We are interested in evaluating if the genotype at a specific marker is associated with being effected by a phenotype.
Consider a SNP with alleles 1 and 2. We have 3 genotypes, where we het is the heterozygote status and hom is homozygote status of allele 2:
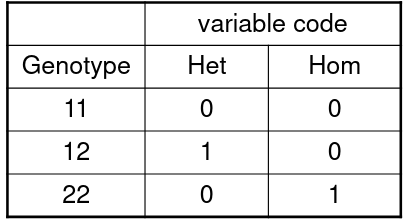
Model: ln(odds for affected | geno) = 𝛽0 + 𝛽1Het + 𝛽2Hom
Our test has 2 degrees of freedom with H0: 𝛽1 = 𝛽2 = 0
So the odds ratio comparing genotype 12 to 11: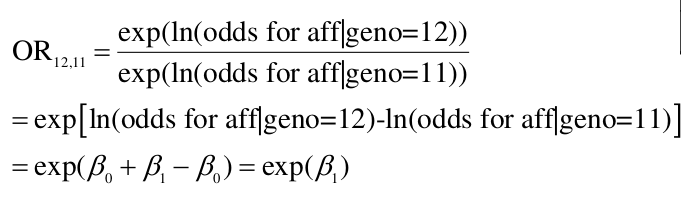 Evaluates to be the same as the e to the power of the coefficient of heterozygote variable. We assume is the same as comparing genotype 22 to 12, since we only consider 1 allele at a time.
We can also test if there is a difference between 12 and 22 by creating a dominant and recessive model
Below we look at an additive model where ADD denotes the number of "1" alleles, which we'll assume is more rare than "2" alleles (the reference group):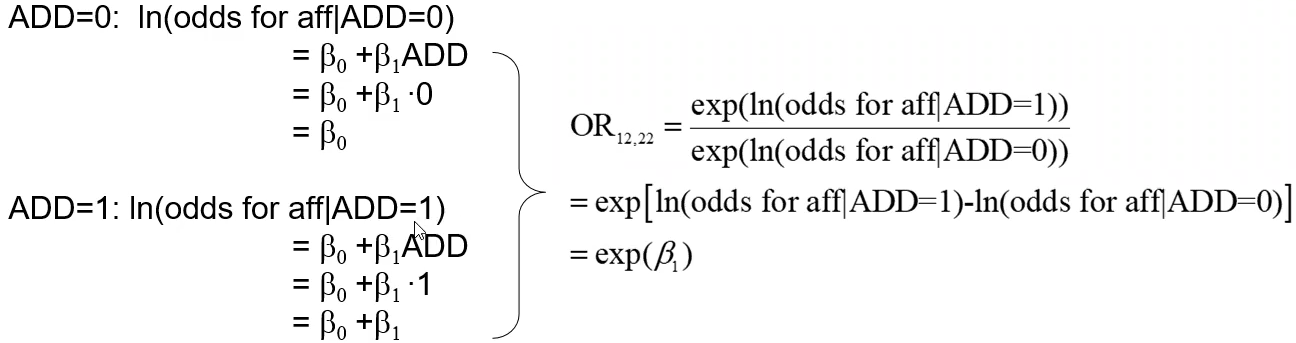
Interpretation
General model:
"The odds of disease for the 12 genotype is OR12,22 times the odds of the disease for the 22 genotype, and the odds of disease for the 11 genotype is OR11,22 times the odds of disease for the 22 genotype."
Additive model:
"The odds ratio increases multiplicatively by exp(𝛽1) for each additional 1 allele"
"The odds of disease increase by a factor of OR12,22 for each additional 1 allele"
"The odds of disease for the 12 genotype is OR12,22 times the odds of disease for the 22 genotype and the odds of disease for the 11 genotype is OR11,22 times the odds of the disease for the 12 genotype."
Determining the Type of Model
Based on Beta Estimates
Compare the beta coefficients from the general model to determine the best genetic model (general, additive, dominant, recessive).
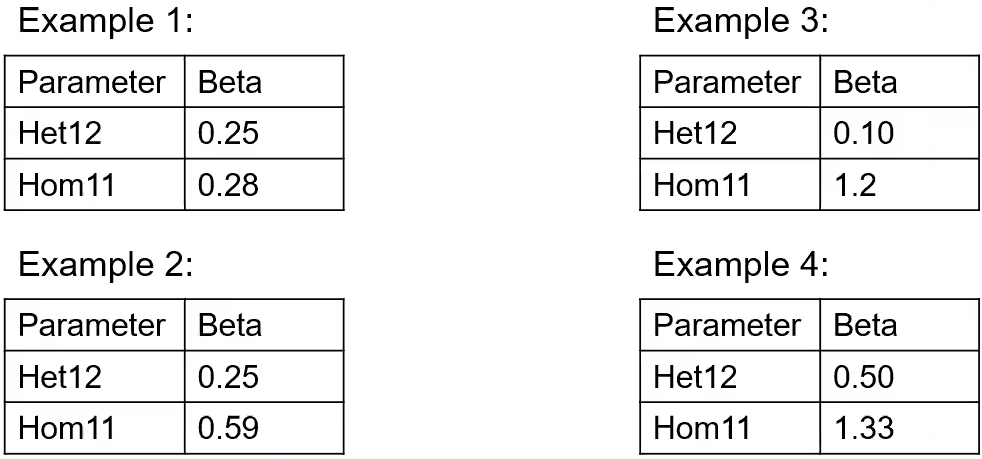 1 is dominant because the estimates are nearly the same between heterogygous and homozygous
2 is additive because the het geno is roughly half the hom geno
3 is recessive because there is only an effect if there is a 11 allele
4 is general because it doesn't fit any of the above criteria
Case-Control Tests
Tables vs. Logistic Regression Tests
- Allele-based contingency tables assume HWE (assumes the two alleles are independent and have additive effects).
- Logistic regression with additive model assumes additive effects, but not independence of alleles.
- General model with no covariates in logistic regression will yield very similar results as 3x2 genotype x case status chi-square test.
Cross-Sectional and Cohort Studies
Association Testing for Quantitative Traits
This is typically performed in a random sample from the population. The most common testing method is linear regression; genotypes can be coded exactly as shown for logistic regression. Parameters here are the mean difference in the outcome due to difference in genotype.
H0: There is no association between alleles (or genotypes) and this trait; 𝛽1 = 𝛽2 = 0
From there we pretty much use the same equation as above: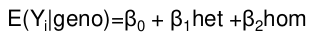
For example, in a table coded identical to the one above, the mean difference in 12 and 11 simplifies to the coefficient of beta for 12 genotype:
𝛽0 + 𝛽1 - 𝛽0 = 𝛽1
Confounding
Recall that a confounder is a third factor which is related to both exposure and outcome, and which accounts for some or all of the observed relationship between the two.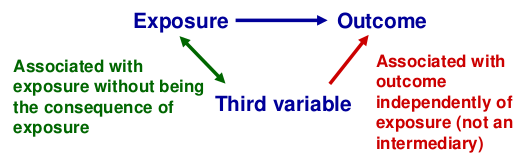
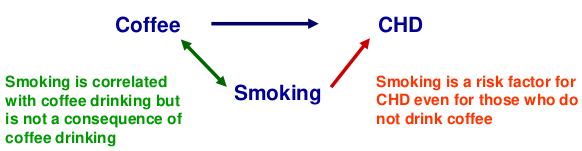
When testing for association between a SNP and phenotype confounders might be population structure, but SNPs are very unlikely to be confounded as behavioral and environmental factors do not alter DNA and vice versa.
Mixing two populations can cause spurious association, or departure from HWE, causing alleles at 2 loci to appear associated even though they may be on different chromosomes.
While it's unlikely to confound in the strict sense, adjustment for behavioral and environmental factors may be helpful if they affect the phenotype independently of the genes of interest. (increased precision of estimate -> increased power)
How to Deal with Structure?
When the sub-populations are known:
- Stratify analyses by sub-populations
- Adjust for sub-population in regression (population dummy variables)
When factors defining sub-populations are unknown or difficult to measure:
- Genetic principal components analysis (requires genome-wide or AIM genotype data)
- Family-based designs: family controls are matched on cases or ancestry
Useful Guidelines
- Race/ethnicity - social categories
- Influences social factors which influence health
- Avoid reinforcing the idea that race is that same as genetic ancestry
- Ancestry - genetic origins
- Influences frequencies of variants in different populations; patterns of LD among variants.
- Avoid using self-reported race as genetic ancestry
Always explicitly distinguish between variables that derive from non-genetic, reported information vs. genetically inferred information.
No Comments