Population Genetics
Genotype and Allele Frequency Estimation is the first step in studying a polymorphism. Used for family data and independent individuals in a population. We can use a subset of individuals who are independent and count alleles, or use the maximum likelihood methods to take all genotypes into account for pedigree data.
Consider the following example of allele frequency estimation: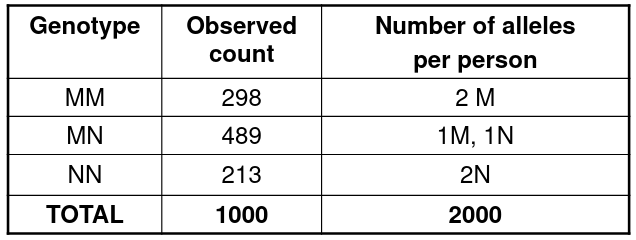
We can take the frequency of each allele by the observed proportions:
pM = (2*298 + 489)/(2*1000)
pN = 1 - pM
Hardy-Weinberg Law
Describes how we expect allele frequencies and phenotype frequencies to be related in a population.
- For a large, random-mating population, in the absence of forces that change allele frequencies, the allele and genotype frequencies remain constant from one generation to the next
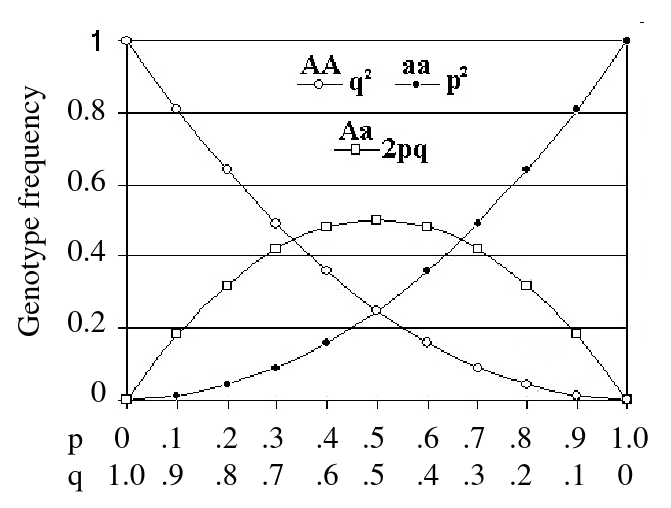
- After one generation of random mating, for an autosomal locus with alleles 1 and 2 (frequencies p and q = 1 - p), the relative frequencies of the genotypes 11, 12, and 22 are:
p2, 2pqm q2
Assumptions
- Random mating with respect to genotype
- No assortative mating
- No population structure
- No selection, mutation, or migration
- Discrete generations
- Infinite population size
- Autosomal locus
Given two alleles with 1 and 2, there are 6 possible parent mating types: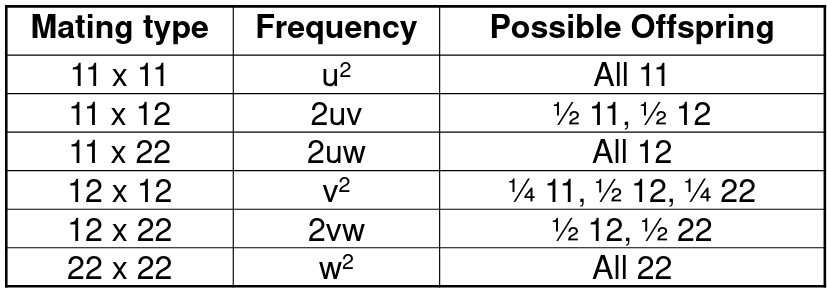
So the frequency of allele 1 in the offspring would be:
P(11) + ½P(12) = (u+v/2)2 + (u+v/2)(v/2+w) = (u+v/2)(u+v+w) = u+v/2
Similarly, the frequency of allele 2 is: w + v/2
Forces that change allele or genotype frequency (invalidate HW law)
- Mutation
- Migration
- Selection
- Deleterious mutations tend to be rare if there is selection against them
- Exception: Heterozygote advantage for a recessive deleterious
- Deleterious mutations tend to be rare if there is selection against them
- Drift - small populations
- Non-random mating
Testing for HWE
Though several assumptions of the HW law are not met in any population, genotypes in a population usually conform reasonable well to expectations, due to the various forces cancelling each other out.
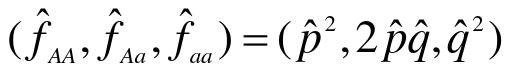
H0: The genotype frequencies math the HW expectations (p2, 2pqm q2)
- Estimate allele frequency (p_hat)
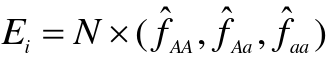
- Determine the expected genotype frequencies from the estimated allele frequency, assuming null is true
- Compute the expeceted genotype counts
- Compare observed genotype counted to expected
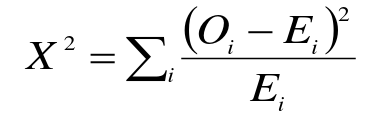


Compare X2 to a chi-squared distribution with 1 degree of freedom. This is usually the number of categories minus 1, but we lose an additional degree of freedom since we estimate allelic frequencies from the data (3-1-1).
Conclusion: The observed genotype frequencies are [not] significantly different from the expectations of the HW equilibrium.
When we reject the HWE, we usually don't know why other than the assumptions being violated.
Exact HWE Test
There are (2N)!/nA!nB! possible arrangements for the alleles in the sample. Under HWE the probability of observing exactly nAB heterozygotes in N individuals with nA alleles is: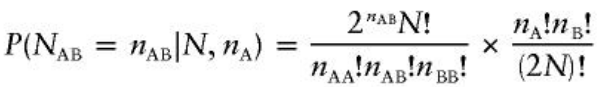
Under many conditions, samples of affected individuals will not be in HWE for alleles associated with disease BUT controls should be close to HWE, as should population-based (unascertained) samples. Note also that genotypes among related individuals may not be in HWE since the individuals are not independent.
If the observed genotypes in unaffected controls (whole random sample) depart from HWE, this may indicate:
- Bad Assay - non-random genotyping error or non-random missing data
- Population structure (non-random mating)
Often if the HWE test p-value is << .01 in controls, the marker is not used in association analyses.
Population Structure
"Random Mating" occurs within a population, but not within overall population.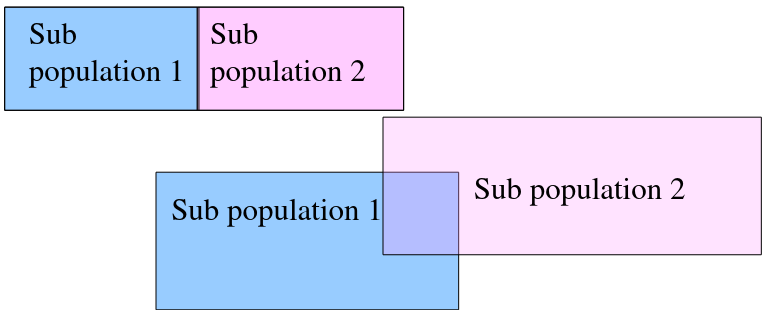
We can observed the combined population to test for structure in sub-populations: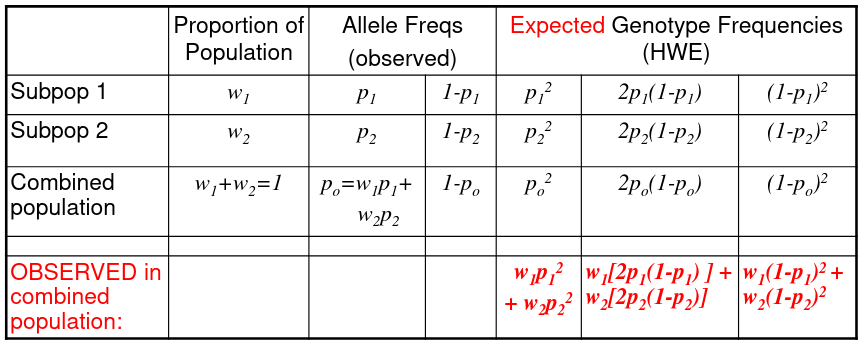
The Heterozygote Deficit = 1 - (observed het freq)/(HWE expected het freq)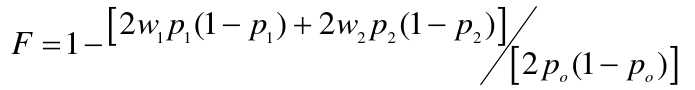
F is the proportional decrease in heterozygotes observed under what would be expected under the HWE.
Linkage Disequilibrium (LD)
Recall a haplotype is a set of markers on the same chromosome that are always inherited together. The haplotype consists of two pieces of information: Genotypes and which alleles are inherited together..
Suppose we have two markers 1, with alleles A and a and freq pA, pa, and 2, with alleles B and b and freq pB, pb
We have 4 possible haplotypes: AB, Ab, aB, ab
If pAB is the probability A and B are on the same chromosome, then we can say pAB = pB * pb if markers are independent
Let Pt(AB) be the frequency of the haplotype AB after t generations of random mating, and theta is the recombination fraction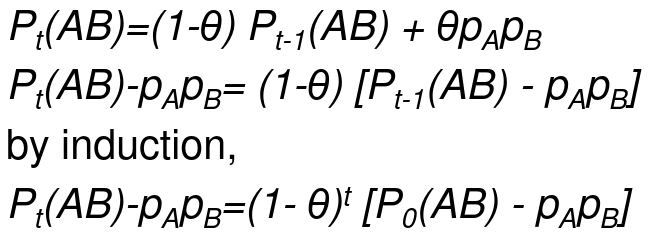
The idea being that we can measure the decay of Linkage Disequilibrium as a function of generations passed: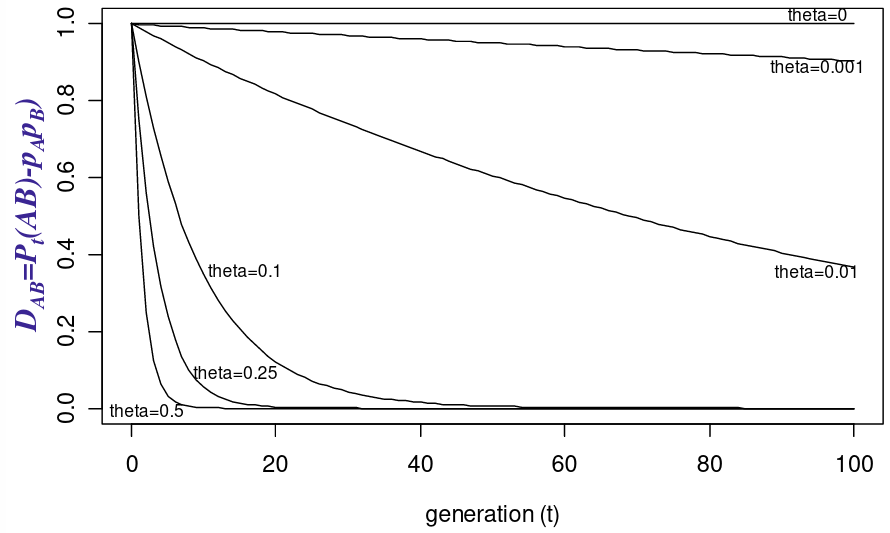
You can also measure this in a pairwise fashion: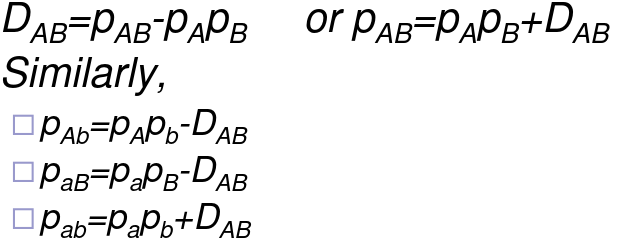
There are problems with the pairwise measure however:
- The sign of DAB is arbitrary
- Range depends on allele frequencies
- Can't easily compare the different pairs of markers
Min and Max of DAB:
If D>0, D ≤ min(pApb,papB)
If D<0, |D| ≤ min(pApB,papb)
D is usaully scaled so that its range is (0, 1) or (-1, 1):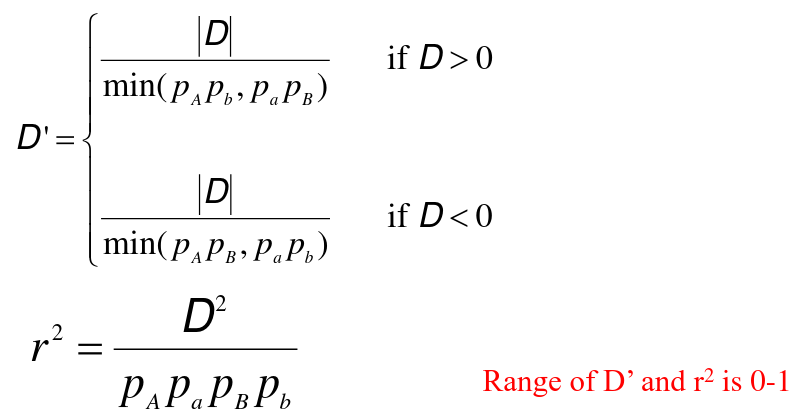
D' = 1 -> No evidence for recombination beteween markers
D' = 1 -> Fewer than 4 haplotypes are observed between two biallelic variants
If allele frequencies are similar D' near 1 -> the markers are good surrogates
D' estimates can be inflated with small sample sizes
D' estimates can be inflated when one allele is rare
No Comments