Interactions in Genetic Assocation Analysis
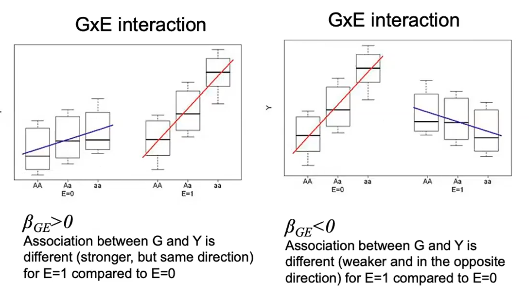
Statistical interaction occurs between two factors if their combined effect is different than what would be expected based on their individual separate effects. In genetics, differences in risk or mean phenotype between genotypes vary according to the exposure (interacting) variable.
Simple example: Phenylketonuria (PKU) is a genetic defect that causes severe intellectual disability only in the presence of dietary phenylalalnine. Every baby is tested for this trait to see if they need a special diet.
Modeling Statistical Interaction
We need a model to form an expectation for the joint effect, which we can use to define the interaction. The definition of interaction relies on some specification of non-interactive effects.
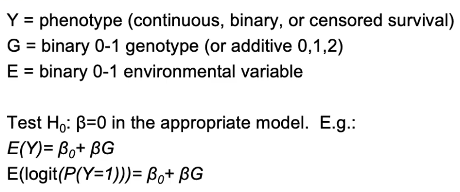
Let Gi be the genotype for person i, and Ei be an environmental factor for a person i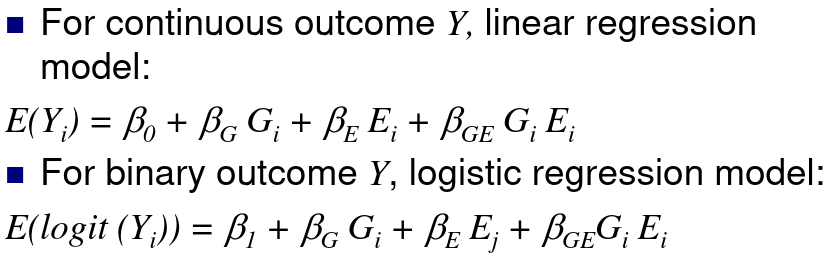
H0: βGE = 0; No interaction, the measure of association βG between the distribution of the phenotype Y and the genotype G does not depend on E.
- Model interaction is always written as a departure from additive effects
- For both logistic and linear regression, this translates to departure from additivity of effects
- For logistic regression
- Interaction == departure from additivity of log(ORs)
- This is the same as departure from multiplicative OR effects
- Interaction in logistic model is multiplicative interaction on the scale of the odds ratio
- OR GE != ORg*ORE
- ORG,E=1 != ORG,E=0
Example logistic model with interaction (CP = cleft palate):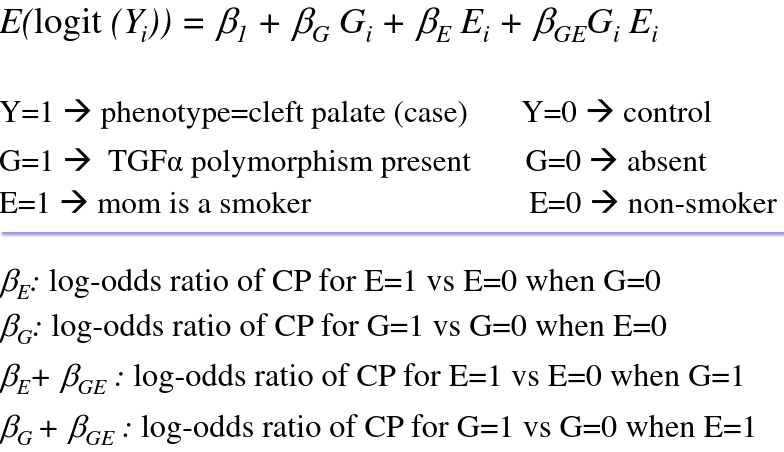
So there are 2 interpretations of βGE:
1. The difference between the Environment logOR when G = 1 vs when G = 0
2. The difference between the Genotype logOR when E = 1 vs when E = 0
The odds ratio of exposure to non-exposure is exp(beta), or the increased odds of disease at the locus for each additional allele is exp(beta) times smaller for exposure group than non-exposure group.
- Overall we define βGE is the difference between the observed ln(OR) and the ln(OR) expected when the G and E act additively
- When βGE = 0 (exp(βGE) = 1):
- no departure from additivity
- the genotypic OR in the two groups E = 1 and E = 0 are the same
- the environment odds ratios in the two groups G = 1 and G = 0 are the same
If there is interaction, we should not use summary measures (OR & genotypic means) for the marker or the environmental factor alone. We may improve power to identify genes and SNPs by testing within subgroups of the interacting exposure, or just testing for interaction.
Detecting Interactions: Power
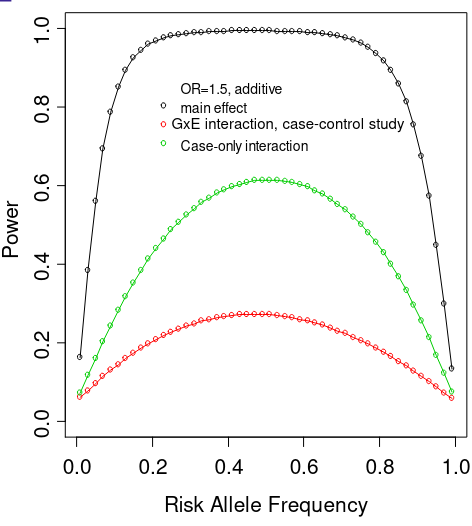
Even in the GWAS era, there are very few well-known examples of interaction of GxE that have been identified. This is in part due to the fact that tests for interaction are not as powerful as tests for main effect association.
We need much larger sample sizes to detect interaction than main effects, at least 4x the size is needed for same effect. Due to lack of power published reports of GxE interactions may be more prone to publication bias (although usually interaction is not the primary hypothesis in a study). It is better to publish all results to avoid publication bias, but this also leads to many published interactions that have not been replicated.
This power issue is particularly a problem when a large number of markers are tested; as always multiple testing adjustment is required to preserve family-wise error rate. We'll focus on two strategies for maximizing power when conducting GxE GWAS have been proposed: Case-only designs and two-stage screening procedures
Case-Only Design
If G and E are independent (depending on design, in population or among controls) cases from a case-control study can be used to estimate the multiplicative GxE interaction.
When G and E are independent in the controls, the OR for the G-E association among cases equals the multiplicative interaction between E and G. ??Improved precision: acts like a case-control or cohort study with an infinite number of controls.??
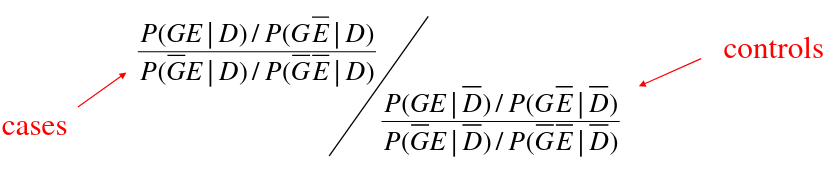
The interaction OR is the ratio of G-E OR in cases to G-E OR in controls. D_bar represents the controls, D represents cases.
If G and E are independent in the controls then the joint probability P(GE | D) = P(G | D)*P(E | D) and the ratio of ORs is just the E-G OR among cases.
We can test for G-E interaction by looking at the G-E association in cases.
Advantages
- Can be inexpensive for exploratory analyses
- Useful for case tissue specimens archived from earlier studies
- Power for the case-only interaction test is much greater than for interaction test in case-control study with same number of cases
- When independence assumption is met, case-only design is much more powerful than case-control logistic regression test of interaction

Limitations
- Provides non information about main effects
- The interaction estimate can be biased if the assumption of G-E independence is violated
Two-Stage Screening Procedure
As we've seen GxE tests have poor power compared to the main effect tests, as the multiple testinig problem is more serious. One way to improve power is to do fewer tests, which gives a smaller multiple testing correction and thus larger significance level.
For example, a genome wide test for smoking and SNP interaction power will be very low, as we are usually accounting for > 2.5 million SNPs, so we would need to use a multiple testing correction like alpha = 5x10^-8
Screen procedures are one way to choose which GxE tests to do. A screening procedure gives us a way to select only a small subset of the SNPs m << M to test for G-E interaction. So, we adjust for m SNPs instead of M SNPs, making significance alpha/m instead of alpha/M.
The tricky part is the screening procedure must be independent of the G-E interaction test in order to maintain alpha, also the screening test needs to be good at identifying variants that are likely to have a G-E interaction.
- Stage 1: screen all GWAS SNPs to identify the subset for which there is likely to be a GxE interaction
- Stage 2: Test for interaction only for the m SNPs that passed the stage 1 screening
- Use the same data set for stages 1 and 2, this is different than discovery replication 2 stage design which use independent data sets
- Procedures for screening:
- Main effect screen - stage 1 screen based on main effects of genotype
- If the SNP is not associated with the outcome phenotype it does not pass stage 1
- SNP-E screen - Stage 1 screen based on SNP-E association
- If the SNP is not associated with E it does not pass stage 1
- Appropriate only for case-control samples
- Main effect screen - stage 1 screen based on main effects of genotype
Kooperberg LeBlanc Stage 1 (Main G Effect Screening)
Perform test using all data (E = 0 and E = 1)
- When a GxE interaction exists, except crossover interactions, there will be some evidence of G-Y association in at least some E subgroups(s)
- When the association is strong, it can also be detected marginally in all exposure groups combined
- First stage screening will identify the SNPs more likely to show interaction
- First stage marginal G-Y association test is approximately independent of second-stage interaction test, so significance is preserved
- Most SNPs are not strongly marginally associated with Y so will be removed from consideration of interaction
- Works with cohort data, any phenotype
- Power is lower when the G-Y association is in a different directions in different E strata
Murcray Stage 1 (SNP-E Screening)
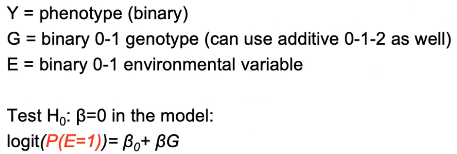
This test is only performed with cases and controls combined.
- If there is no G-E association in the population, interaction exists when there is evidence of G-E association in cases
- When this association is strong, it can also be detected in cases and controls combined
- Assumes cases are ~1/2 the sample
- If cases are a small part of of sample, this screen won't work properly (not independent of GxE test)
- Most SNPs will not be associated with E
- First stage "screening" test will identify SNPs likely to exhibit multiplicative interaction with E on case status
- First-stage marginal G-R association test is approximately independent of second-stage interaction test, so the significance level for stage 2 corrects only for the stage 2 tests performed
No Comments