Sequencing Data and Analysis of Rare Variants
Genotyping arrays can be obtained at pre-selected sites for each sample. Ex. Genotyping sites known to be polymorphic based on prior sequencing.
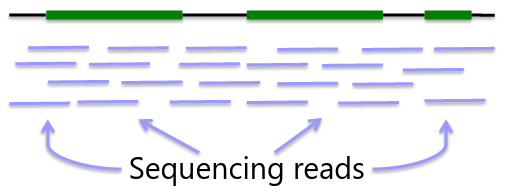
Sequencing is obtaining "every" base in the exome or genome for each sample. Most of the sequence is identical across samples. This is used to find locations that are polymorphic, or differ across samples.
Whole Genome Sequencing
Genome: ~3GB per individual
Advantage - whole genome coverage
Disadvantage - cost ~$1000 for 30x, limited interpretability
Whole "Exome" Sequencing
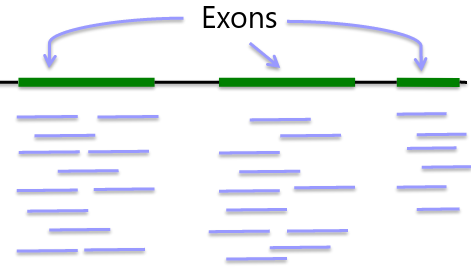
Exome: ~33MB per individual
Advantage: Covers protein coding regions, interpretable variation, cost ~$500
Disadvantage: Missing 99% genome coverage
VCF Format
Variant Calling File (VCF) is a standard format for storing sequencing data. It includes genotypes for all sites where at least one individual had alleles different from references alleles for all individuals in the study.
Every VCF file has three parts in the following order:
- Meta-information lines or Header (begins with ##)
- Last Meta-information line: Record Header (line beginning with #CHROM)
- Data lines (Body) contain marker and genotype data (one variant per line)
- A data line is called a VCF record
- Each VCF record has the same number of tab-seperated fields as the record header line
- The symbol "." is used to denote missing data
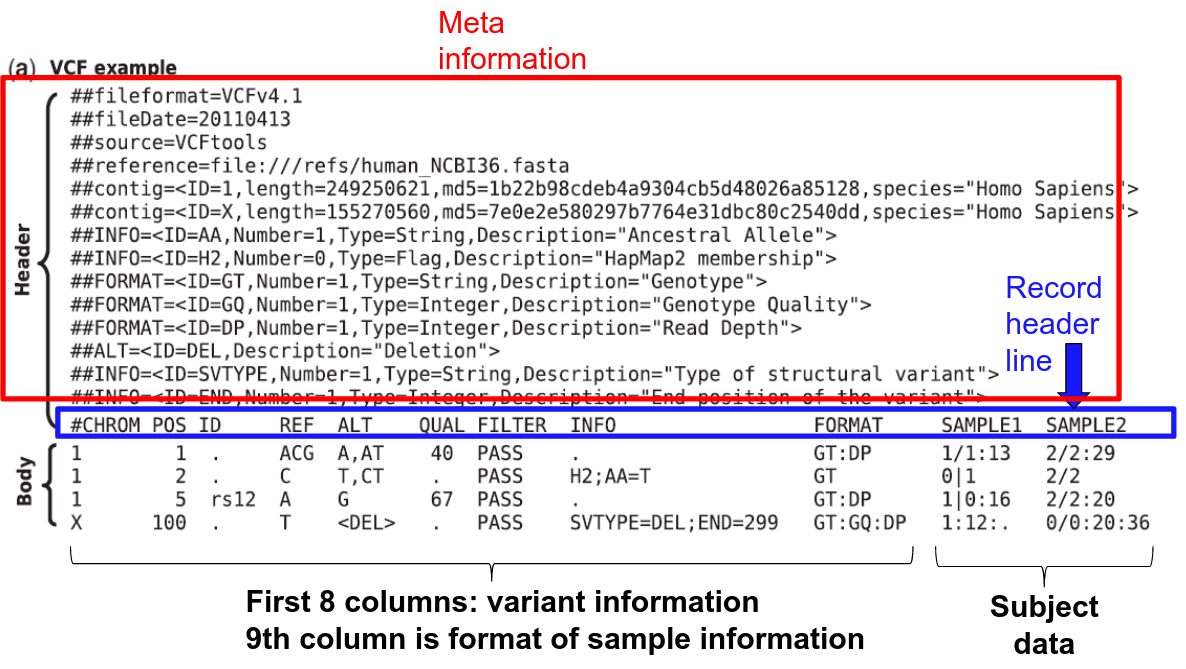
The first nine columns of the data record give information about the variants:
1. CHROM – the chromosome number/id
2. POS – the genome coordinate of the first base in the variant.
Within a chromosome, VCF records are sorted in order of increasing position.
3. ID – a semicolon-separated list of marker identifiers (often rsid)
4. REF – the reference allele expressed as a sequence of one or more A/C/G/T nucleotides (e.g. "A" or "AAC")
5. ALT – the alternate allele expressed as a sequence of one or more A/C/G/T nucleotides (e.g. "A" or "AAC"). If there is more than one alternate allele, the field is a comma-separated list of all alternate alleles.
6. QUAL - The Phred-scaled probability that a REF/ALT polymorphism exists at this site given sequencing data. A value of 10 indicates a 1 in 10^1 chance of error, 50 indicates 10^5 chance of error, etc.![]()
7. FILTER - Either "PASS" or a semicolon-separated list of failed quality control filters
8. INFO - Values in INFO are defined in the header. Contains additional information about the variant represented as tag-value pairs, where the tag and value are separated by an equals sign, and pairs are separated by colons. Usually it is information summarized from the samples, but can also include information from other sources such as population frequencies from a database.
9. FORMAT - Explanation of information in FORMAT are defined in the header. As for INFO, a colon-separated list. Describes the format of the data reported for each sample in the file.
There are many tools that can be used with VCF and BCF (binary version of VCF), such as bcftools and plink.
"Missing Heritability"
GWA studies are great for identifying SNP associations, but usually loci identified have small effects on traits. Much of the phenotypic variation or risk due to genetics ("heritability") is unexplained.
Unexplained variance/risk may be due to:
- Many additional variants with very small effects
- Non-SNP variants such as structural variants not typed by current GWAS chips.
- Epigenetic factors: methylation
- Over-estimation of heritability due to:
- Genetic interaction
- Dominance effects
- Shared environment
- Rare variants that we have have not yet been tested
Rare Variants
There are a lot of different rare variants, they are very common! Rare variants are more likely to be functional/deleterious. The best way to find rare variants is to sequence.
Recent expansion of the human population supports the theory of causal rare variants (there's 8 billion people today). Multiple causal rare variants have been found within genes. Animal studies suggest larger effects of rarer variants.
MAF (Minor Allele Frequency) cutoff can be used to define a "rare" variant (this level makes a difference in analysis).
Association Analysis with Rare Variants
The problem with single variant tests such as regression methods is that there are too few observations to provide a stable test.
We can combine rare variants by grouping them by gene region or functional information (exomes, non-synonymous or nonsense, predicted function), which can improve power.
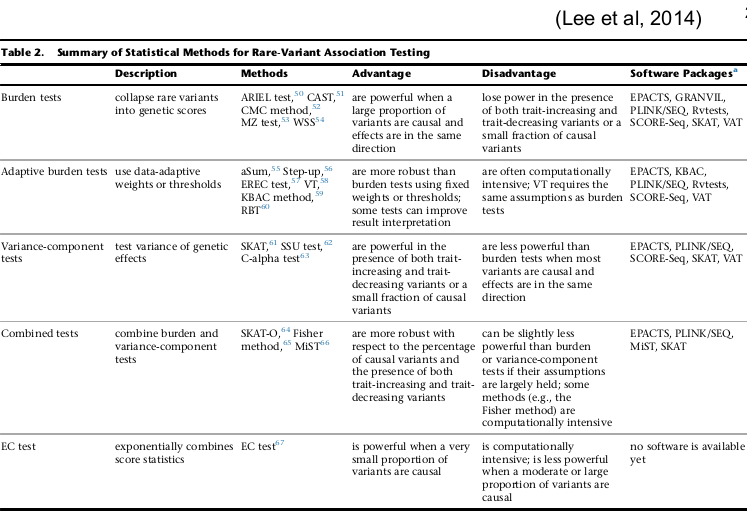
Burden Tests
- Instead of testing rare variants individually, group variants likely to have similar function
- Score presence or absence of rare variants per individual -- use rare variant score to predict trait values
- Makes the assumption that the effect of all rare variants is in the same direction
- If all variants grouped in a test are causal, leads to a large increase in power
- Success (power) depends on:
- Number of associated variants contributing to signal
- Number of neutral (null) variants
- direct of effects
CAST
- Compare the frequency of cases and controls with at least one mutation within a gene or region
- Can be thought of as an indicator approach
- Xi = 1 when subject i has at least one rare variant in the region/gene
- Xi = 0 when a subject i has no rare variants
- CAST score can be tested against any type of outcome in regression framework
- Assumes same effect whether a single or multiple rare variants occur in a region in an individual
Unweighted Sum / CMC
- An extension of CAST
- An unweighted sum of the rare variants in a gene or region
- Commonly used to collapse rare variants into a score of minor alleles
- Regression (linear or logistic) used to test association with the rare variant score (sum)
- All variants included in the sum are assumed to have the same magnitude and direction of effect
RVT1
- An extension of CAST/CMC
- Instead of the sum, uses the proportion of sites at which an individual carries a rare variant as the predictor
- Accounts for missing data:
- ni - Number of rare variants for which subject i has been genotyped
- ri - Number out of the ni sites where individual i carries at least one rare allele
- Score is ri / ni
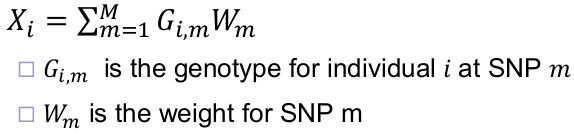
Weighted Sum of the Variants
Risk Allele Frequency:
For case-control outcomes: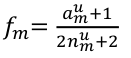
am: total number of minor (or risk) alleles for the SNP m
nm: total number of subjects for SNP m
aum: number of minor (or risk) alleles in the unaffected subjects for SNP m
num: total number of unaffected subjects for SNP m
Gi,m: is the number of risk variants for SNP m in individual i
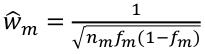
Madsen and Browning proposed using a weight based on the inverse of the MAF in the unaffected sample. Lower MAF SNPs have a larger weight. Makes the assumption that the rarer variants have a large phenotypic effect.
- Weights can be developed using any criterion; Allele frequency, function, previous evidence. There is no "best" way
- Use weight in a regression to include covariate and use for quantitative outcomes
- Allows variants to be treated differently based on beliefs about likelihood of functionality
- Still assumes all variants have effect in same direction
Variable Threshold (VT) Model
- Addresses arbitrary MAF cutoff of other burden tests
- Calculates test statistics across many MAF cutoffs
- Chooses maximum test statistic over all MAF cutoffs
- Controls for over fitting using permutation
- Computationally expensive
- Regression framework -- quantitative or qualitative outcome, covariates
- All variants in MAF bin have the same direction of effect: Weights:
- 0 for variants that are excluded based on MAF
- 1 for variants included
Variance Component Tests (SKAT)
Sequence Kernel Association Test
- Test of the joint effects of multiple variants in a region on a phenotype
- Regression framework: allows for inclusion of covariates
- Does not require permutation
- Does not get an estimate of effect size (beta)
We want to test H0: Beta_1 = Beta_2 = ... = Beta_m Or t = 0
Assume: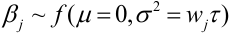
t is a variance component and wj is a pre-specified weight for variant j, usually chosen to be a function of the MAF.
Under the null hypothesis Q is a mixture of chi-squared distributions.
Variance component score test statistic:
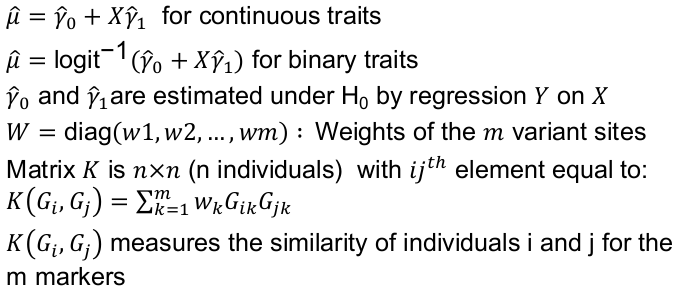
For the weights the original paper recommends this weight for variant j:
wj = Beta(MAFj, alpha1, alpha2), with alpha1 = 1 and alpha2 = 25 or Madsen-Browning uses alpha1 = .5 and alpha2 = .5
SKAT-O
The goal is to combine the best features of SKAT and burden tests into one test with optimal power. Burden tests have good power when all variants have similar effect size & direction. SKAT has better power when many variants are null and/or effects in opposite directions.
- Unified test statistic is a weighted sum of the burden test statistic QB and the SKAT statistic
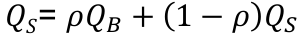
- The weight sigma can be interpreted as the correlation of regression coefficients of the variants
- If close to 1: collapse all variants and use burden test
- If close to 0: all different, SKAT is most powerful
- Asymptotic distribution is mixture of chi-square 1df (for QB) and mixture of chi-sqaures (for QS)
- P-value can be computed analytically with numerical integration
Significance Thresholds for Rare Variant Tests
Depends on:
- Type of sequence study
- Targeted
- Exome
- Whole genome
- Type/numbers of tests performed
- One test per gene
- Multiple tests per gene -- whether different or same tests were run on SNP sets
- Are the tests independent
- Testing a region already known to have a signal
- Using independent samples
- Using the same samples that identified the region
Bonferroni for the number of tests performed can also be applied. Though it is likely to be conservative, even if tests are independent -- some tested genes/regions do not have sufficient variation. Unless the study is very large, p-values likely to be less significant than expected under H0: no association.
Conditional Analysis
For regression-based tests, a conditional analysis amounts to including the associated common variant AND the rare variant score in the same model.
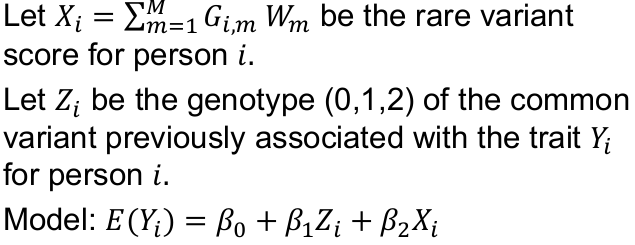
To test whether the rare variant score is associated with the trait conditional on the common variant:
H0: Beta_2 = 0
If the test is significant then the association between Yi and common variant Zi does not fully explain the association observed between Yi and rare variant score Xi, i.e. the rare variant is not just a proxy for the common variant or vice-versea.
No Comments