Tree Based Methods
Classification and regression trees can be generated from multivariable data sets using recursive partitioning with:
- Gini index or entropy for a categorical outcome
- Residual sum of squares for a continuous outcome
We can use cross-validation to assess the predictive accuracy of tree-based models.
Non-Linear Regression
Polynomial Regression adds extra predictors by raising original predictors to a power. Provides a simple way to provide a nonlinear fit to data.
Step functions/Broken stick regression cuts the range of a variable into K distinct regions. Fits a piecewise constant function/regression line.
Regression splines and smoothing lines is an extension of the two above. The range of X is divided into K distinct regions. Within each region a polynomial function is fit to the data. It is constrained in a way which smoothly joins at the region boundaries, or knots. It can produce an extremely flexible fit if there are enough divisions.
Classification and Regression Trees
Classification and Regression Trees (CART) are a computer intensive alternative to fitting classical regression models. CART works very well for highly non-linear problems.
- These involve stratifying or segmenting the predictor space into a number of simple regions.
- In order to make a prediction for a given observation we typically use the mean or mode of the training observations in the region which it belongs to.
- Classification trees apply when the response it categorical
- Regression trees apply when the response is continuous
A regression tree is basically just a multiple linear regression model with indicator variables that represent the branches of the tree.
Regression Tree
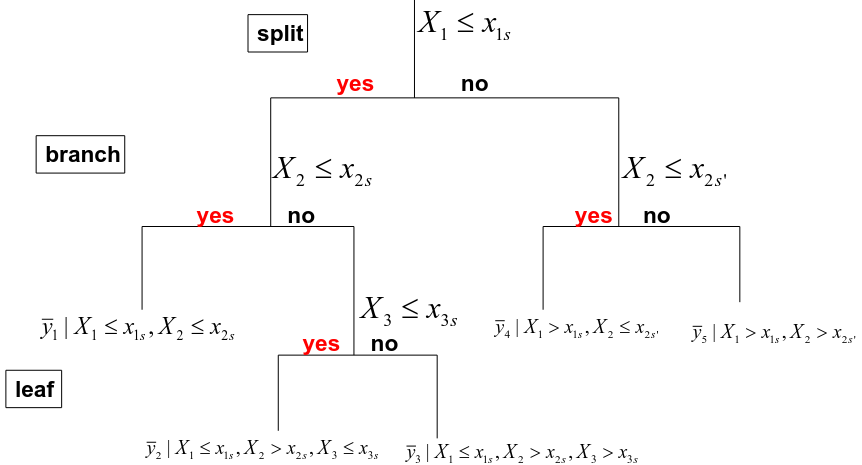
Note: Number of leaves = complexity
- We divide the predictor space into J distinct and non-overlapping regions R1, R2, Rj.
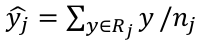
- The fitted value in a region Rj is simply the mean of the response values in this region :
Goal: The regions are identified to minimize:![]()
Where Rj is the rectangle corresponding to the jth terminal node and y_barj is the mean of the training observations in Rj
A complete search is not feasible and we take a top-down, greedy approach known as recursive binary splitting.
Top-down: Start from the top of the tree
Greedy: Best solution at each node of the tree (local rather than global)
Recursive Binary Splitting
Input: "explanatory" variables and outcome Y
For each variable Xg,
without splitting Xg, the variable Y has a certain variability![]()
Splitting the data by Xg < s, then the new RSS is:![]()
- Identify the split of the variable to minimize the new RSS
- Identify the variable whose split minimizes the new RSS
- Repeat in each region in a recursive way
Residual Mean Deviance
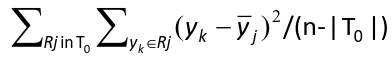
T0 = tree; | T0 | = number of leaves; y_bar = mean in region Rj
Pruning
Build a large tree and fold terminal branches back. This can be based on a maximum number of leaves, or use cost-complexity pruning.
Typically pruning overfits the data (too many splits). A smaller tree with fewer splits might lead to better interpretation at the cost of higher residual deviance.
Possible alternatives: Build the tree only so long as the decrease in the RSS due to each split exceeds some threshold. This strategy may terminate too early.
The idea here is to minimize RSS
For a given alpha search for the tree T nesting into T0 that minimizes: ![]() where alpha=cost; |T| number of leaves
where alpha=cost; |T| number of leaves
Use a heuristic search to find alpha
Cart for Prediction
To access the accuracy of a regression tree to predict Y in new patients, you can evaluate the predictive accuracy by using a training and testing set.
Classification Tree
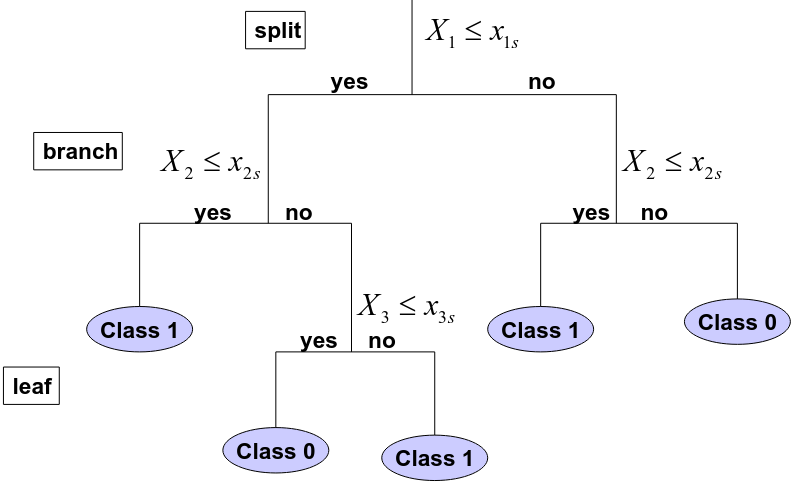
Input: Explanatory variables and a class label for different samples
The objective is to choose the tree which maximizes the classification accuracy
The procedure (same as regression tree with 2 differences):
- The fitted value at each terminal node is the most frequent label
- The deviance is replaced by a "measure of information" or classification error
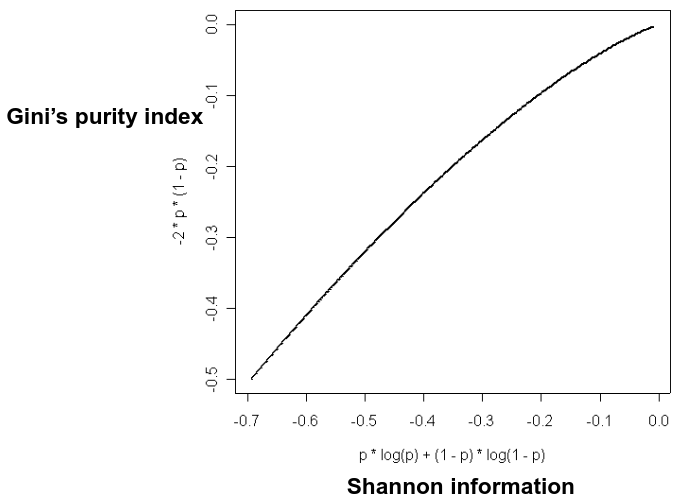
Shannon Entropy
Shannon entropy is the most common measure of (Lack of) information content of a binary variable: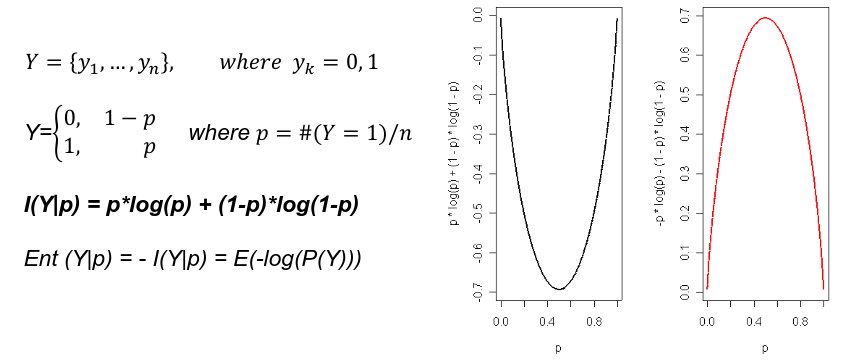
Gini's Impurity Index
Gini's Impurity Index is the information content of a binary variable.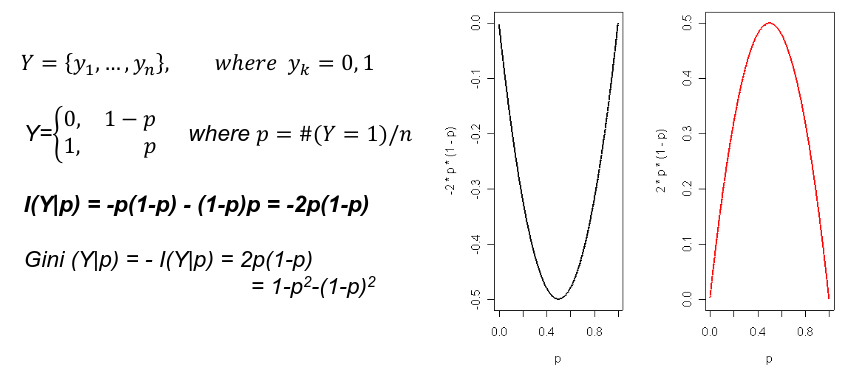
Best Split
For each variable:
- Compute the information gain for each xgs
- Identify the split that gives the largest information gain
Do this linear search for each variable and identify the optimal split and maximum gain of information.
Split the node by using the variable that gives the largest information gain with a binary split.
Typically Gini index is used for growing a tree, and misclassification error is a good metric for pruning a tree.
Pros and Cons of Trees
- Very easy to explain, even more so than linear regression
- Some people think decision trees more closely mirror human decision-making than previously seen classification and regression.
- Trees can be displayed graphically and are easily interpreted by a non-expert
- Trees can easily handle qualitative predictors without the need to create dummy variables.
- HOWEVER, trees are not precise for prediction. By using methods like bagging, random forests, and boosting the predictive performance can be substantially improved.
Bagging, Boosting, and Random Forest
- Bagging is a useful procedure when the goal of analysis is prediction
- Generate many subsets of data by randomly sampling subsets of the data (with replacement so the subject can appear more than once in the same set)
- In each subset generate a tree without pruning
- Using the average of the prediction from all the trees to compute the final prediciton
- Sampling with replacement to estimate statistical quanitities is known as bootstrap
- Random Forest is similar to bootstrap
- The difference is in each bootstrap sample the set of covariates to build the tree is randomly selected selected rather than using all of them
- Boosting grows a family of trees sequentially
Bagging and Random Forest improve prediction at the cost of interpretability.
One can generate an importance value of each covariate as the average improvement of RSS (or entropy or Gini index) due to the covariate in each tree and rank the covariates by this importance value.
The larger the average change in deviance, the more important the variable.
Classification Rules
The data is split into testing and training sets. We use the training set to build the classification rule; and the test set to evaluate how the classification rule labels new cases with known label.
Accuracy is the rate of correctly classified labels in the test set.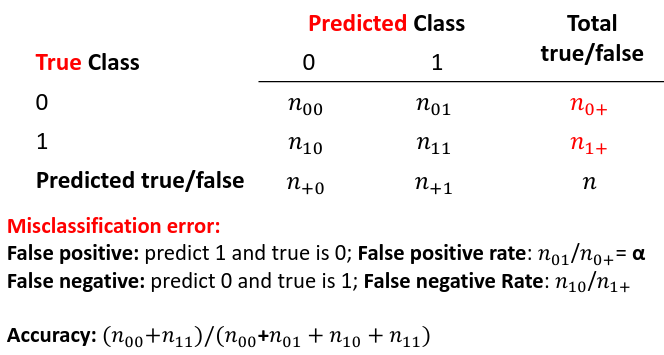
Sensitivity is a metric of true positive detection and shows whether the rule is sensitive to identify positive outcomes: 
Specificity is the measure of true negative detection and showos whether the rule is specific in detection of negative outcomes:

No Comments