Classification
Classification is often used to describe modeling of a categorical outcome.
In binary classification the outcome is two possible values/classes and the goal is the predict the correct class using covariates.
Classification rule: A mathematical function to predict the outcome of a new sample unit when the values of the covariates are known.
Common Classification Problems
- Molecular diagnostic: Using values of gene products (such as biomarkers) develops a diagnostic tool for early detection of diseases.
- Classification of cancer type: Different sub-types of cancer are characterized by a combination of specific markers that are on/off. Gene based classification rules can be used to increase the specificity of the diagnosis.
- Classification of drug response
- Risk prediction
Types of Classifiers
- Regression-based:
- Logistic regression, CART
- Example-based:
- KNN
- Based on Bayes theorem:
- Discriminant analysis
- Ensemble of classifiers
To evaluate a classifier, split the data into a training and test set. Use the training set to build the classification rule and the test set to evaluate how the classification rule labels new cases with known label.
Logistic Regression
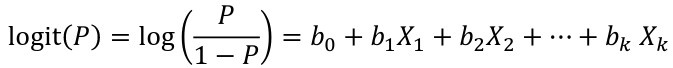
bi, i = 0,1... k can be estimated using Maximum Likelihood
To estimate the probability of a binary outcome as a function of covariates with logistic regression: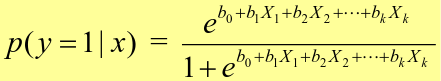
How to Pick Classification Rule
We can use the above formula for x in [0,1] to generate thresholds based on the predicted value to decide how to classify.
Accuracy is the rate of correctly classified labels in the test set: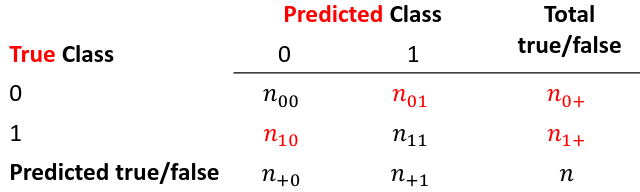
Misclassification error:
False positive: prediction 1 and true is 0; n01 / n0+
False negative: predict 0 and true is 1; Fn10 / n1+
Accuracy: (n00 + n11) / (n00 + n01 + n10 + n11)
Sensitivity (recall) the metric of true positive detection and shows whether the rule is sensitive to identify positive outcomes: 1 - n10 / n1+ = n11/n1+ = 1 - FNR
Specificity is the measure of true negative detection and shows whether the rule is specific in detection of negative outcomes: 1 - n01 / n0+ = n00 / n0+ = 1 - FPR
You CANNOT maximize sensitivity and specificity simultaneously. Maximum sensitivity test always says 1, maximum sensitivity always says 0.
Positive/Negative predicted values: The number of correct all predicted positive/negative values
ROC (Receiver Operating Characteristics) Analysis
The ROC curve is a population graphic for simultaneously displaying the two types of errors for all possible thresholds. They are useful for comparing different classifiers since they take into account all possible thresholds.
The overall performance of a classifier, summarized over all possible thresholds is given by the area under the ROC curve (AUC). An ideal ROC curve will hug the top-left corner, so the larger the AUC the better the classifier.
We expect a classifier that performs no better than chance to have an AUC of .5
Steps to Build and Evaluate Classification Rule:
- Generate training and test set
- Generate the classification rule using the training set;
- Generate the predicted rules in the test set;
- Use ROC analysis to decide the threshold that gives a good balance between sensitivity and specificity.
- The next examples will show a variety of methods to generate classification rules (so step 2)
The previous chapter describes methods to create classification trees and K-nearest neighbor.
Discriminant Analysis
Logistic regression involves directly modeling P(Y = k | X = x) using logistic function. An alternative approach will model the distribution of the predictors X separately in each of the response classes, then use Bayes theorem to flip these around into estimates for P(Y = k | X =x)
Assuming the covariate x is normally distributed: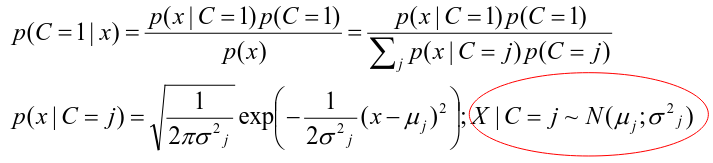
Binary outcome: Classify as 1 if p(C = 1 | x) > p(C = 0 | x)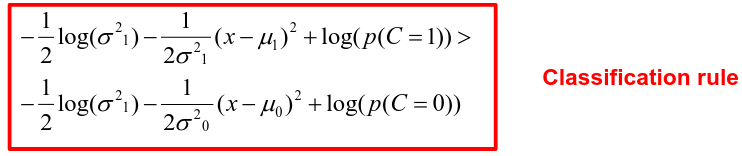
A special case when the variances of X in the groups are the same: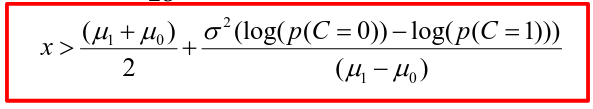
More than One Feature
To extend this approach to multiple covariates, one needs to decide:
- How to model the correlation of the covariates within each group defined by the outcome
- If the correlation of the covariates changes in different groups
LDA - assumes equal variance-covariance structure between groups
QDA - assumes group specific variance covariance matrices
LDA/QDA models all covariates as normal distributions
Summary
For each method:
- Fit the classification model using training data
- Evaluate the classification accuracy in test data using ROC analysis
- Can also choose a “best” threshold to optimize sensitivity/specificity
- Compare different classifiers by their AUC
The final classifier should be trained on all data to be used for future applications
There is no single "Best Classification Method". There is clear evidence that different methods work better in some data and worse in others. Thus, we often use the prediction probabilies of various classifiers to build an ensemble, using prediction probabilities from various rules. This is limited as there is no description of mechanism, useful only for prediction.
No Comments