Stratification and Interaction
Which Summary Measure to Use?
- Weighted averages are usually best
- Mantel-Haenszel is easy to compute and can handle zeros
- MLE measures are difficult and typically require a computer
Weighted Average in MH Summaries
Consider the following table:
| Sample 1 |
Sample 2 |
|
| n |
30 |
70 |
| x_bar |
5 |
8 |
Weighted average of population -> ((30*5)+(70*8))/(30+70) = 7.1
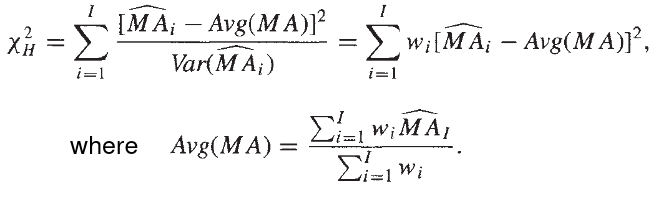
The average mean is closer to the cohort with a larger sample size. We can calculate any weighted average with the general form:
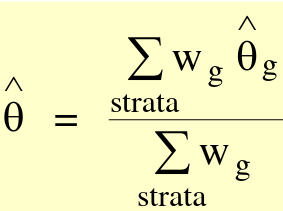
Where theta_hat is an estimator, such as mean or OR.
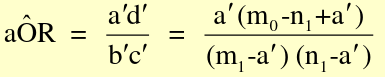
The MH Odds Ratio and RR can be described as weighted averages:
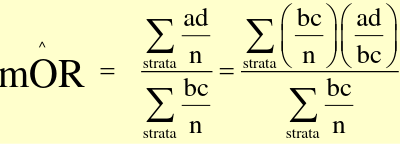
Where the weights are (b*c)/n
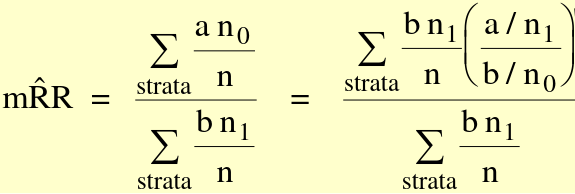
Where (a/n_1) / (b/n_0) is the risk ratio in each stratum, (b*n_1 / n) is the weight
Assumptions of Mantel-Haenszel Summary Measures
- Observations are independent from each other
- All observations are identically distributed
- The common effect assumption should hold:
- Follow-up cohort study - The stratum-specific risk ratios are all equal across the strata
- Case-control - The stratum specific odds ratios are all equal across the strata
MH measures are biased if the correctness of the common effect assumptions cannot be justified.
An extreme example: When interaction exists with protective and detrimental effects across strata; Protective effects negative in numerator in a stratum, and detrimental effects positive in numerator in another stratum.
Precision-based Summary Estimators
Also called Woolf's Method. Precision-based summary estimators are also weighted averages. Weighing each stratum according to its sampling error gives the most weight to the strata with the smallest variance. Precision-based are designed to have the greatest precision (smallest standard error). For Ratios we often take the log scale for a more symmetrical distribution. The general approach:
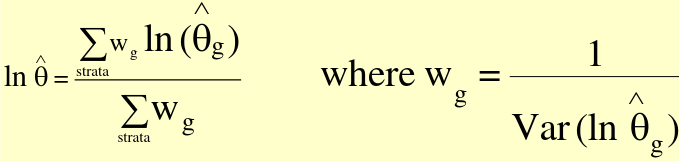
This is the sum of the products of each stratum-specific ratio times its weight, all divided by the sum of weights.
Precision-based Summary Odds Ratio
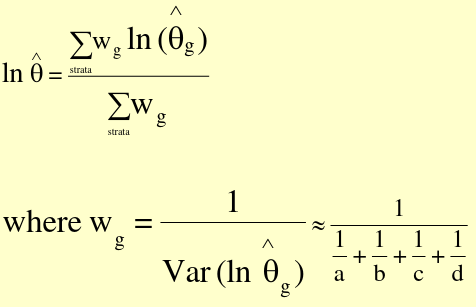
Thus, Var(ln(OR_hat) ~ 1/a + 1/b + 1/c + 1/d
Precision-based Summary Risk Ratio
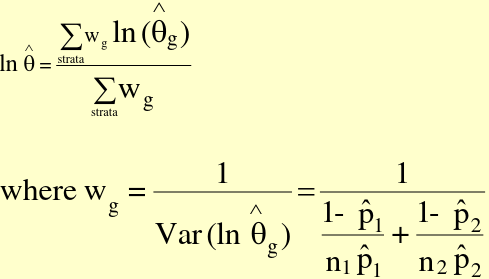
Thus the Var(ln(RR_hat)) = ((1-p_hat1)/(n_1*p_hat1) + (1 - p_hat2)/(n_2*p_hat2))
Confidence Intervals of Summary Measures
There are 2 types of CI intervals: Test-based (from a test statistic) and Precision-based (uses standard error). Most of the time both will yield very similar intervals.
Test-Based CI
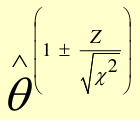
Precision-based CI
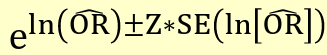
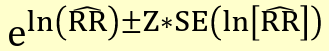
Where the standard error is the square root of the variance above.
Comparision
Precision-based summary ratios are straightforward, and best when the number of strata is small, and sample size within each strata is large. Cannot be calculated when any cell in any stratum is 0 as log(0) is undefined, though one could correct .5 at risk of bias.
MH Method can handle 0 cells. The assumption is that all counts are large enough, if there are small counts in some strata the CI will not be valid.
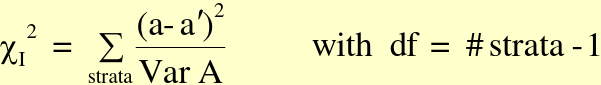
Hypothesis Testing of Interaction
Tests for interaction (effect modification):
H0: OR1 = OR2 = ... = ORg / H0: RR1 = RR2 = ... RRg
Tests of Association from Stratified 2x2 Tables:
H0: No association and the summary (adjusted) measure = 1
Breslow-Day Test
This is default test for interaction in SAS.
Steps: Calculate summary OR, use summary OR to get expected number of exposed cases per strata, if no interaction compare with actual number of exposed cases for each strata
H0: OR1 = ... ORg (g strata)
H1: at least two measures are different
Conclusion: We have [in]sufficent evidence to [reject/accept] the null hypothesis that all the associations between X and Y adjusted by strata are equivalent.
Where a = observed value in gth stratum and a| = fitted or expected value of under H0 in gth stratum
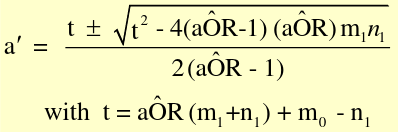
a| should be comparable with table margins (determines whether to add or subtract the radical)
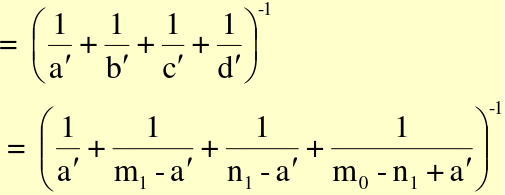
Variance under H0 in the gth stratum:
Assume a common OR (mOR) and create adjusted:
Woolf Test
- Can be used for RR or OR
- Calculate summary OR, compare strata-specific ORs to summary OR
- .5 is added to each cell as a small-sample adjustment (optional)
Most often, Breslow-Day and Woolf's test produce similar test statistics. Woolf's method has a theoretical derivation of the weights based on large counts in each cell. If there are small counts in a strata, the CI is invalid.
No Comments