Standardization
The objective of standardization is the compare the rates of a disease (or outcome) between population which differ in underlying characteristics (age, sex, race, etc) that may affect the overall rate of disease; In essence it's another way to account for confounding.
Standardization of Rates
The difference between crude rates and standardized rates is that the crude rates are calculated on the population under study, whereas standardized rates are based on particular characteristic(s) as standard. If the rates are calculated based on the specific characteristic(s), they are called specific rates (eg. age specific mortality rates, or sex specific mortality rates).
While the MH and Precision based tests assume uniformity of estimates across strata, standardized estimators do not. Thus, these summary measures ignore non-uniformity and mask interactions.
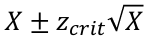
CI of Standardized Rate
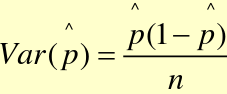
Variance:
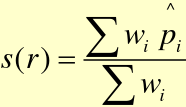
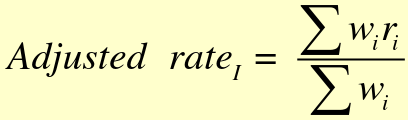
Standardized Rate is a Weighted Average:
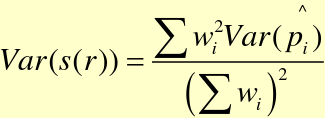
Variance for a Standardized Rate:
There are two approaches to Standardization of Rates:
Direct Standardization (Most Common)
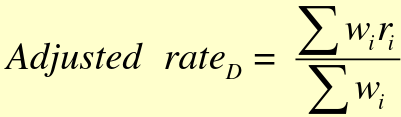
wi are the frequency from "standard" population, ri are rates from testing population. Very similar to the "weighted average" method from the last chapter.
- Stratum-specific rates (ri) from population under study
- Strata distribution (wi) from a "standard" population
- My rates, standard weights
There are many choices for the 'standard' population.
- Internal Standard - one of the groups under study, total population of the study
- External standard - outside, a larger group (ex. US population)
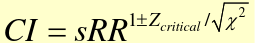
Direct Standardization Test-Based CI for sRR
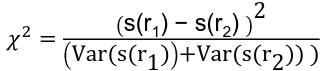
Chi-square test for s(r1) = s(r2) is a variation on z test comparing two proportions:
Indirect Standardization
Used when rates in your population are not estimated well due to small sample sizes. We need :
- Crude rate in population/sample under study
- Strata distribution of popuation/sample under study
- Stratum-specific rates (and crude rates) for "standard" population
wi are the frequency from testing population and ri are rates from "standard" population.
- The stratum-specific rates in the study of interest are not reliable due to small sample size.
- Stratum-specific weights (wi) from population under study
- Strata distribution (ri) from "standard" population
- My weights, standard rates
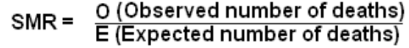
Results are often presented as a Standardized Mortality Ratio (SMR):
We can also calculate the standardized rate based on the standard population rate and teh target cohort-specific SMR:
s(r) = (Population Rate) x SMR
Indirect Standardization Test-Based CI for sRR
CI for an observed count using the Poisson model (SE = sqrt(mean)):
Standardized Estimators
All summary measures ignore non-uniformity and mask interaction, very similar to last chapter's tests for confounding with weights.
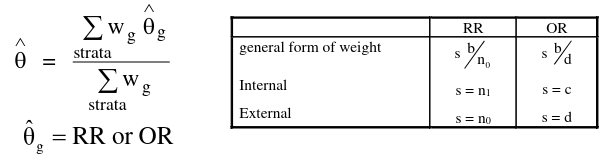
's' can also be weights (frequencies) derived from a standard population.
For RR:
- Internally Standardized
- s = n1 = exposed subjects sRR
- Externally Standardized
- s = n0 = unexposed subjects s'RR
For OR:
- Internally Standardized
- s = c = exposed non-cases sOR
- The interpretation of the OR would be something like: "If study participants who were not exposed to X have the same distribution of a confounding variable as those exposed to X who did not develop Y, then the increased odds of Y is OR for study participants exposed to X."
- s = c = exposed non-cases sOR
- Externally Standardized
- s = d = unexposed non-cases s'OR
- The interpretation of the OR would be something like: "If study participants have the same distribution of a confounding variable as those not exposed to X who developed Y, then the increased odds of Y is OR for study participants exposed to X."
Equivalent Estimators to the Standardized Risk Ratio:
- Directly standardized risk ratio with unexposed used as standard population
- Externally standardized RR
- SMR with unexposed as standard population
- Internally standardized RR
Test for Linear Trend in Odds Ratios
Test with several exposures, 2 * k tables (for association), or a series of 2 * 2 tables (for effect modification/interaction).
Note: Odds ratios are sensitive to non-linear transformations, but non-linear transformations can alter results.
Mantel Extension Chi-Square for 2 * k Tables
Let X = an ordinal score for exposure
H0: No linear (monotone) association between exposure and disease (proportion)
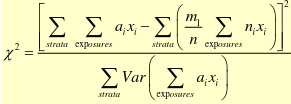 with df = 1
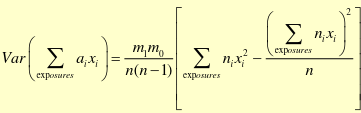
And each stratum has variance:
Conclusion: We find a [de/in]creasing trend in incidence of [Outcome] with increasing levels of [independent] (p < .05), with ORs changing from OR_before to OR_after.
Test for Linear Trend in Odds Ratio for Several 2x2 Tables
The model we use is logarithmic: ln(OR) = b0 + b1X
We are testing H0: b0 = Odds Ratios for all tables OR All Odds Ratios are equal
Measure if there is an interaction present (ORs not all the same), or modelling interaction (ORs change systemically).
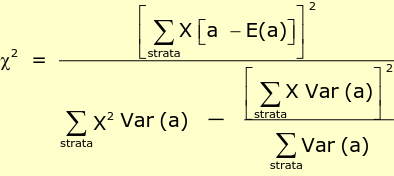 with df = 1
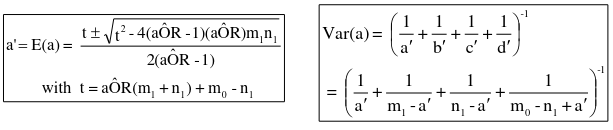
Where X is the score, and E(a) is the expected score under H0. E(a) and Var(a) can be computed as in the Test for homogeneity of Odds Ratios (Breslow-Day):
No Comments