Analysis of 2x2 Tables
Review of Measures of Association
| Exposed |
Unexposed |
||
| Disease |
a |
b |
m1 |
| No Disease |
c |
d |
m0 |
| n1 |
n0 |
n |
m1, m0, n1, and n0 are marginal totals and n is the overall total
Prevalence is the proportion of sampled individuals that possess a condition of interest at a given point in time.
Incidence is the proportion of individuals that develop a condition of interest of interest of a period of time.
The Odds Ratio (OR) of an outcome are the ratio of the probabilty that the outcome occurs to the probability that the outcome does not occur:
OR = ((a / n1) / (c / n1)) / ((b/n0) / (d/n0)) = (a/c) / (b/d) = ad / bc
Risk Ratio (RR), or relative risk, compares the risk of a health event among one group with the risk among another group:
RR = (a / (a + c)) / (b / (b + d)) = (a / n1) / (b /n0)
We would interpret the RR as: People in "group A" have RR times the risk for being a case compared to the people in "group B".
The OR is always farther from 1 than RR (unless both equal 1). If a rare disease OR ~= RR
Risk Difference (RD):
RD = a / (a + c) - b / (b + d)
RR and RD are only appropriate for incidence or prevalence studies, NOT case-control studies.
When testing if there is an association between two variables (H0 = Slope is 0), we could also set RR = OR = 1 or RD = 0.
Common Tests For Association
- Standard Chi-Square statistic (also called Pearson chi-square)
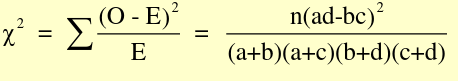
Where O is observed and E is expected, with 1 degree of freedom (n-1)
- Mantel-Haenszel Chi-Sqaure statistic
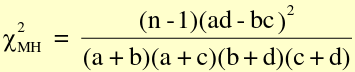
Similar to standard chi-square, with n-1 instead of n
- Large sample Z statistic to compare proportions
- Large sample Z statistic for exposed events
For a 2x2 Table:
- The standard chi-square and Mentel-Henszel chi-square statistic are completely equivalent to each other
- The large sample z for proportions and exposed events are completely equivalent to each other
- The z statistics and chi-square statistics are nearly equivalent to the first two
- The z statistics can be looked up via R or textbook appendix
Confidence Intervals
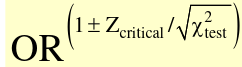
CI is not a probability! Proper interpretation of a 95% CI: If we repeatedly take samples of the same sample size from the population and build 95% confidence intervals for the OR, then we are 95% confident that the interval covers the true OR.
A test-based CI for OR:
Confounding in Epidemiology
Bias refers to any systematic error in an epidemiological study that results in an incorrect estimate of the true effect of an exposure on an outcome of interest.
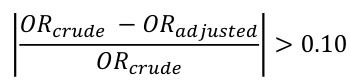
Confounding occurs when a variable influences both the dependent (outcome) and independent (exposure) variable, causing a spurious association. When confounding is present a measure of association may change substantively in comparing the measure without adjustment.
If a measure, such as RR or OR, changes by more than 10% we conclude there is confounding.
Confounder, Mediator, and Collider:
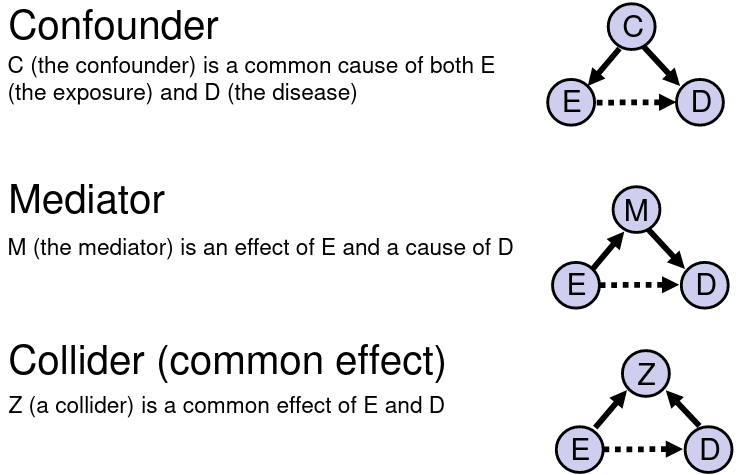
If we are interested in the total effect of an exposure on an outcome we should adjust for confounders, but not colliders or mediators. If the confounder is a categorical variable, we may stratify the samples on the confounder.
Mantel-Haenszel Method
The Mantel-Haenszel Method (mOR) is a weighted average of the OR for each stratum:
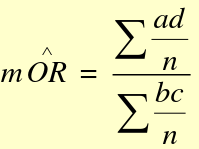
(bc)/n is the weight for each stratum.
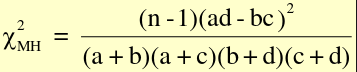
We hypothesis test with the MH Chi-square test for summary measure:
H0: OR1 = OR2 = OR3.... = 1 or mOR = 1
Ha: OR1 = OR2 = OR3.... != 1 or mOR != 1
For testing a single 2x2 table with the MH Chi-Square Test for a summary measure:
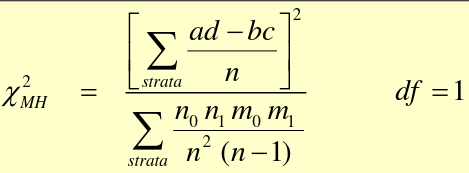
For analysis of several 2x2 tables:
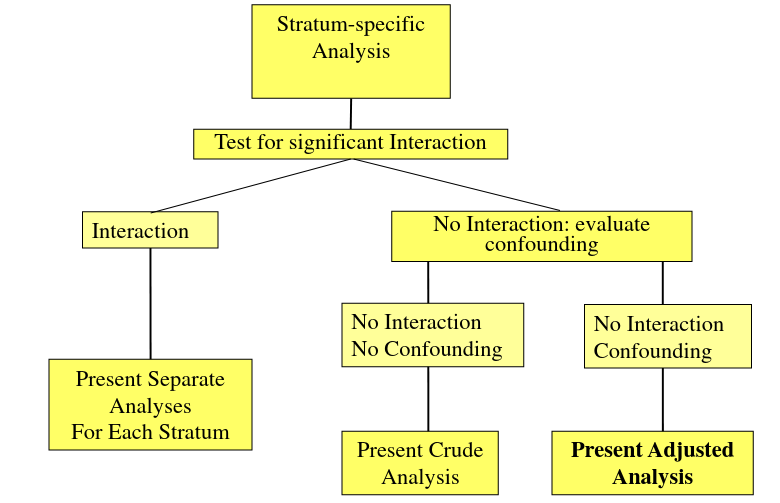
A Flow-Chart: Steps to Follow
No Comments