# Stratification and Interaction
##### Which Summary Measure to Use?
- Weighted averages are usually best
- Mantel-Haenszel is easy to compute and can handle zeros
- MLE measures are difficult and typically require a computer
#### Weighted Average in MH Summaries
Consider the following table:
|
| Sample 1
| Sample 2
|
| n
| 30
| 70
|
| x\_bar
| 5
| 8 |
Weighted average of population -> ((30\*5)+(70\*8))/(30+70) = 7.1
The average mean is closer to the cohort with a larger sample size. We can calculate any weighted average with the general form:
[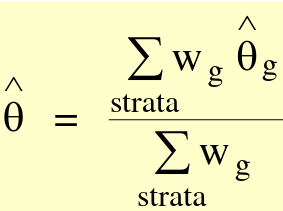](https://bookstack.mitchellhenschel.com/uploads/images/gallery/2022-09/image-1663597273168.png)
Where theta\_hat is an estimator, such as mean or OR.
The MH Odds Ratio and RR can be described as weighted averages:
[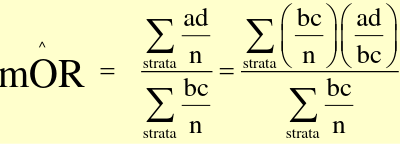](https://bookstack.mitchellhenschel.com/uploads/images/gallery/2022-09/image-1663597467897.png)
Where the weights are (b\*c)/n
[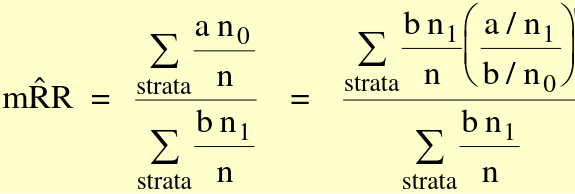](https://bookstack.mitchellhenschel.com/uploads/images/gallery/2022-09/image-1663597533686.png)
Where (a/n\_1) / (b/n\_0) is the risk ratio in each stratum, (b\*n\_1 / n) is the weight
#### Assumptions of Mantel-Haenszel Summary Measures
- Observations are independent from each other
- All observations are identically distributed
- **The common effect assumption should hold:**
- Follow-up cohort study - The stratum-specific risk ratios are all equal across the strata
- Case-control - The stratum specific odds ratios are all equal across the strata
MH measures are biased if the correctness of the common effect assumptions cannot be justified.
An extreme example: When interaction exists with **protective** and **detrimental** effects across strata; Protective effects negative in numerator in a stratum, and detrimental effects positive in numerator in another stratum.
### Precision-based Summary Estimators
Also called **Woolf's Method**. Precision-based summary estimators are also weighted averages. Weighing each stratum according to its sampling error **gives the most weight to the strata with the smallest variance**. Precision-based are designed to have the greatest precision (smallest standard error). For Ratios we often take the log scale for a more symmetrical distribution. The general approach:
[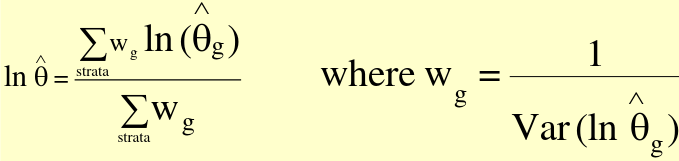](https://bookstack.mitchellhenschel.com/uploads/images/gallery/2022-09/image-1663598561474.png)
This is the sum of the products of each stratum-specific ratio times its weight, all divided by the sum of weights.
#### Precision-based Summary Odds Ratio
[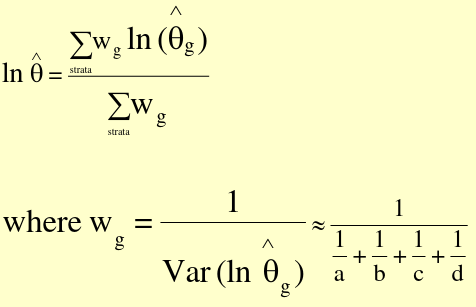](https://bookstack.mitchellhenschel.com/uploads/images/gallery/2022-09/image-1663598719717.png)
Thus, Var(ln(OR\_hat) ~ 1/a + 1/b + 1/c + 1/d
##### Precision-based Summary Risk Ratio
[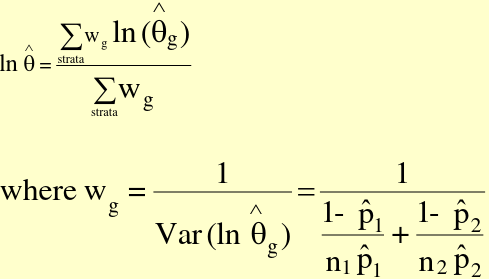](https://bookstack.mitchellhenschel.com/uploads/images/gallery/2022-09/image-1663598910847.png)
Thus the Var(ln(RR\_hat)) = ((1-p\_hat1)/(n\_1\*p\_hat1) + (1 - p\_hat2)/(n\_2\*p\_hat2))
### Confidence Intervals of Summary Measures
There are 2 types of CI intervals: Test-based (from a test statistic) and Precision-based (uses standard error). Most of the time both will yield very similar intervals.
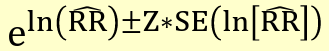
##### Test-Based CI
[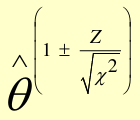](https://bookstack.mitchellhenschel.com/uploads/images/gallery/2022-09/image-1663600038654.png)
##### Precision-based CI
[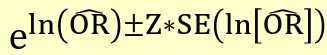](https://bookstack.mitchellhenschel.com/uploads/images/gallery/2022-09/image-1663598835526.png)
[](https://bookstack.mitchellhenschel.com/uploads/images/gallery/2022-09/image-1663598945870.png)
Where the standard error is the square root of the variance above.
#### Comparision
Precision-based summary ratios are straightforward, and best when the number of strata is small, and sample size within each strata is large. **Cannot** be calculated when any cell in any stratum is 0 as log(0) is undefined, though one could correct .5 at risk of bias.
MH Method can handle 0 cells. The assumption is that all counts are large enough, if there are small counts in some strata the CI will not be valid.
### Hypothesis Testing of Interaction
Tests for interaction (effect modification):
H0: OR1 = OR2 = ... = ORg / H0: RR1 = RR2 = ... RRg
Tests of Association from Stratified 2x2 Tables:
H0: No association and the summary (adjusted) measure = 1
#### Breslow-Day Test
This is default test for interaction in SAS.
Steps: Calculate summary OR, use summary OR to get expected number of exposed cases per strata, if no interaction compare with actual number of exposed cases for each strata
H0: OR1 = ... ORg (g strata)
H1: at least two measures are different
Conclusion: We have \[in\]sufficent evidence to \[reject/accept\] the null hypothesis that all the associations between X and Y adjusted by strata are equivalent.
[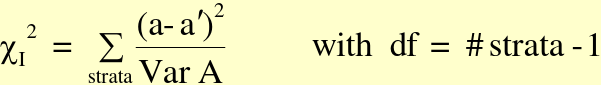](https://bookstack.mitchellhenschel.com/uploads/images/gallery/2022-09/image-1663601308161.png)
Where a = observed value in gth stratum and a| = fitted or expected value of under H0 in gth stratum
[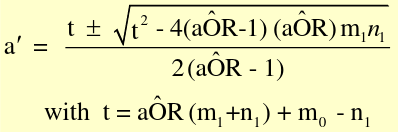](https://bookstack.mitchellhenschel.com/uploads/images/gallery/2022-09/image-1663601551874.png)
a| should be comparable with table margins (determines whether to add or subtract the radical)
Variance under H0 in the gth stratum:
[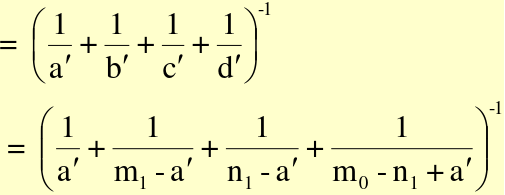](https://bookstack.mitchellhenschel.com/uploads/images/gallery/2022-09/image-1663601420989.png)
Assume a common OR (mOR) and create adjusted:
[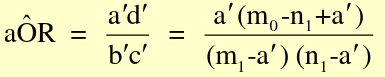](https://bookstack.mitchellhenschel.com/uploads/images/gallery/2022-09/image-1663601505331.png)
#### Woolf Test
- Can be used for RR or OR
- Calculate summary OR, compare strata-specific ORs to summary OR
- .5 is added to each cell as a small-sample adjustment (optional)
[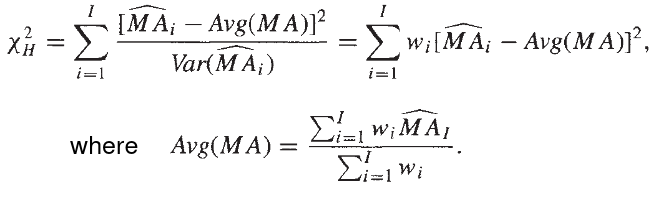](https://bookstack.mitchellhenschel.com/uploads/images/gallery/2022-09/image-1663603113544.png)
Most often, Breslow-Day and Woolf's test produce similar test statistics. Woolf's method has a theoretical derivation of the weights based on large counts in each cell. If there are small counts in a strata, the CI is invalid.