| Exposed | Unexposed | ||
| Disease | a | b | m1 |
| No Disease | c | d | m0 |
| n1 | n0 | n |
OR = ((a / n1) / (c / n1)) / ((b/n0) / (d/n0)) = (a/c) / (b/d) = ad / bc
Risk Ratio (RR), or relative risk, compares the risk of a health event among one group with the risk among another group:RR = (a / (a + c)) / (b / (b + d)) = (a / n1) / (b /n0)
We would interpret the RR as: People in "group A" have RR times the risk for being a case compared to the people in "group B". The OR is always farther from 1 than RR (unless both equal 1). If a rare disease OR ~= RR Risk Difference (RD):RD = a / (a + c) - b / (b + d)
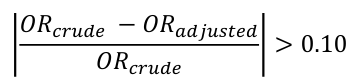
RR and RD are only appropriate for incidence or prevalence studies, NOT case-control studies. When testing if there is an association between two variables (H0 = Slope is 0), we could also set RR = OR = 1 or RD = 0. ### Common Tests For Association - Standard Chi-Square statistic (also called Pearson chi-square) [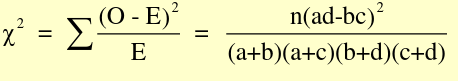](https://bookstack.mitchellhenschel.com/uploads/images/gallery/2022-09/image-1662994513931.png) Where O is observed and E is expected, with 1 degree of freedom (n-1) - Mantel-Haenszel Chi-Sqaure statistic [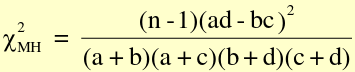](https://bookstack.mitchellhenschel.com/uploads/images/gallery/2022-09/image-1662994580056.png) Similar to standard chi-square, with n-1 instead of n - Large sample Z statistic to compare proportions - Large sample Z statistic for exposed events ##### For a 2x2 Table: - The standard chi-square and Mentel-Henszel chi-square statistic are completely equivalent to each other - The large sample z for proportions and exposed events are completely equivalent to each other - The z statistics and chi-square statistics are nearly equivalent to the first two - The z statistics can be looked up via R or textbook appendix #### Confidence Intervals CI is not a probability! Proper interpretation of a 95% CI: If we repeatedly take samples of the same sample size from the population and build 95% confidence intervals for the OR, then we are 95% confident that the interval covers the true OR. A test-based CI for OR: [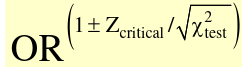](https://bookstack.mitchellhenschel.com/uploads/images/gallery/2022-09/image-1662995242329.png) ### Confounding in Epidemiology **Bias** refers to any systematic error in an epidemiological study that results in an incorrect estimate of the true effect of an exposure on an outcome of interest. **Confounding** occurs when a variable influences both the dependent (outcome) and independent (exposure) variable, causing a spurious association. When confounding is present a measure of association may change substantively in comparing the measure without adjustment.If a measure, such as RR or OR, changes by more than 10% we conclude there is confounding.
[](https://bookstack.mitchellhenschel.com/uploads/images/gallery/2022-09/image-1662995705689.png) ##### Confounder, Mediator, and Collider: [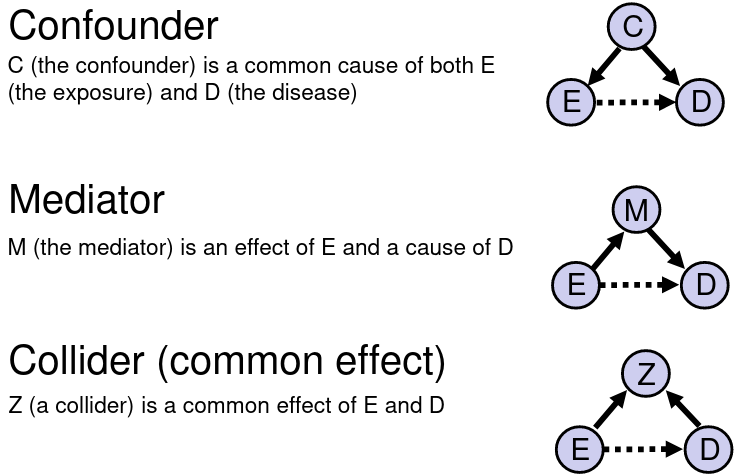](https://bookstack.mitchellhenschel.com/uploads/images/gallery/2022-09/image-1662995914137.png) If we are interested in the total effect of an exposure on an outcome we should adjust for confounders, but not colliders or mediators. If the confounder is a categorical variable, we may stratify the samples on the confounder. #### Mantel-Haenszel Method The Mantel-Haenszel Method (mOR) is a weighted average of the OR for each stratum: [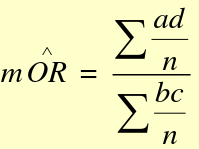](https://bookstack.mitchellhenschel.com/uploads/images/gallery/2022-09/image-1662998288103.png) (bc)/n is the weight for each stratum. We hypothesis test with the MH Chi-square test for summary measure: H0: OR1 = OR2 = OR3.... = 1 or mOR = 1 Ha: OR1 = OR2 = OR3.... != 1 or mOR != 1 For testing a single 2x2 table with the MH Chi-Square Test for a summary measure: [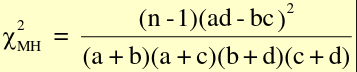](https://bookstack.mitchellhenschel.com/uploads/images/gallery/2022-09/image-1662997626096.png) For analysis of several 2x2 tables: [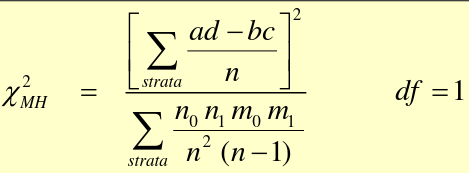](https://bookstack.mitchellhenschel.com/uploads/images/gallery/2022-09/image-1662997544136.png) #### A Flow-Chart: Steps to Follow [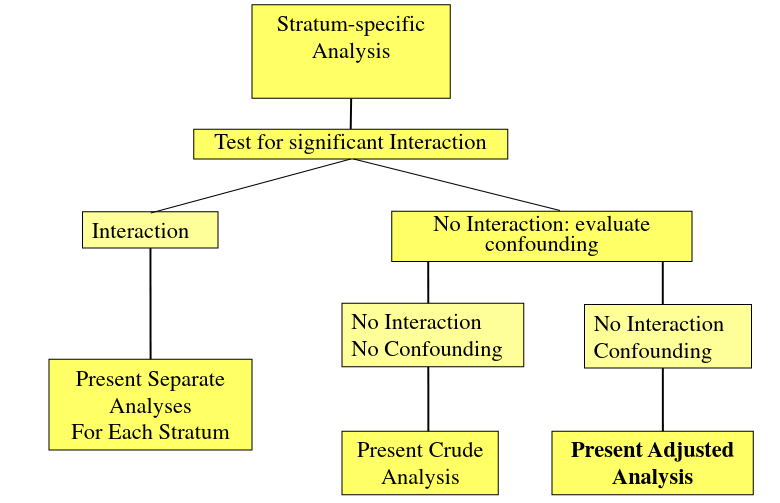](https://bookstack.mitchellhenschel.com/uploads/images/gallery/2022-09/image-1663596331321.png)