Module 14: Topics in Linear Regression
Assumption in Linear Regression:
- Independence between observations
- Linearity between X and Y
- Homoscedasticity - the variance of Y is the same for any value of X
- Normally distributed Y for any fixed value of X
Also, the model is also only generalizable to the population within the range of observed values of X.
Independence
The way we collect data or which data we collect determines independence. Examples of violated independence:
- Data comes from individuals that are related closely
- Multiple observations were collected over time for the same subject
Linearity
In order to test linearity, we would expect a graph of the residuals to be randomly scattered around the horizontal line. If there is a pattern to the residuals, the trend cannot be assumed to be linear.
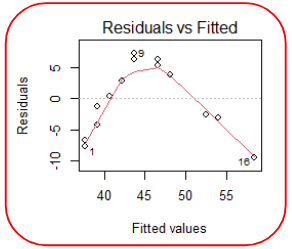
The above residual plot shows a clear trend, thus the linear assumption is voilated.
Homoscedasticity
When talking about homoscedasticity, we require variance of error terms to be similar across independent variables. To assess homoscedasticity we can look at a scatterplot of y vs. x to determine if the spread in y is the same for each value of x.
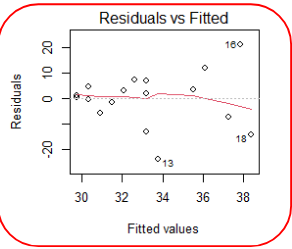
Here we observe the spread of Y increasing as X increasing, thus the homoscedasticity assumption is not met.
Normality
Finally for the normality of data we can examining the histogram of residuals and the QQ plot of residuals. If the data is normally distributed, the points will lie on the line.
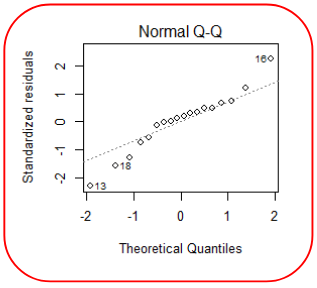
Above is a example were the QQ of the residuals indicates a violation of normality.
Problem Points
Problem points can be categorized as outliers, leverage points, or influential points. A point can be any or all 3.
- Outliers are defines one or more observations that has a large residual. In other words the observed value for the point is much different that that predicted by the model.
- Leverage Points are observations which have a value of x that is far away from the mean of x.
- Influential Observations is an observation that changes the slope of the line. One method to find these points is comparing the fit of the model with and without each observation.
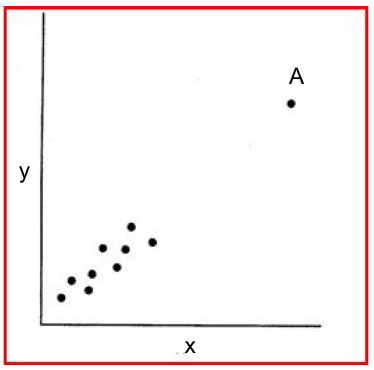
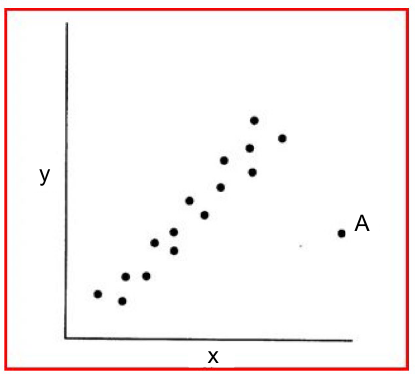
The point A above is a leverage point, but not an outlier or an influential observation.
Here point A is an outlier and an influential observation, but not really a leverage point.
What if the assumptions are not met?
- If linearity is not met, you should consider other models (e.g. quadratic or logistic)
- If normality is not met:
- For correlation analysis we can use Spearman correlation instead of Pearson correlation
- For regression analysis, we can investigate transformations such as log or square root
Spearman Correlation
For use when data is not normally distributed. Sort the data from smallest to largest and create ranks for both X and Y, then calculate the usual correlation on the ranked values.
No Comments