Module 10: Confounding and MH Method
With categorical data, we are classifying data instead of measuring it. As a review:
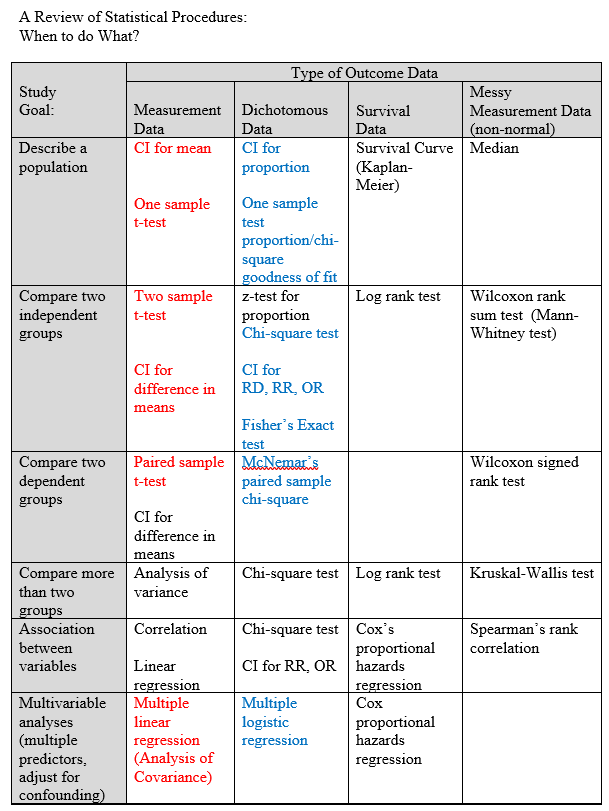
Notice we never use a z test, a t test is almost always more appropriate even for large samples. Likewise, for dichotomous outcomes could use a z-test but a chi-square test is usually used in practice. Chi-square reflects categorical outcomes.
chi-square = sum((obs-exp)2 / exp), df=n-1; where n is the number of random variables or categories.
Mantel-Hansel Method
Cochran-Mantel-Haenszel method is a technique that generates an estimate of an association between an exposure and an outcome after adjusting for or taking into account confounding. We stratify the data into two or more levels of the confounding factor (as we did in the example above). In essence, we create a series of two-by-two tables showing the association between the risk factor and outcome at two or more levels of the confounding factor, and we then compute a weighted average of the risk ratios or odds ratios across the strata
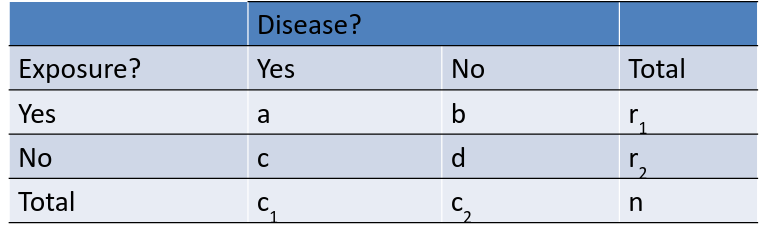
Given the above table, we have the below MH Equations:
For Cell(1,1) frequency has
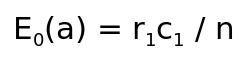
and

For a given table, and the MH test statistic is:
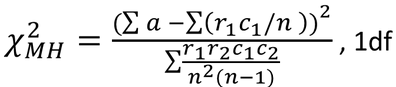
It follows a Chi-Square distribution with 1 degree of freedom.
We can also derive the following:
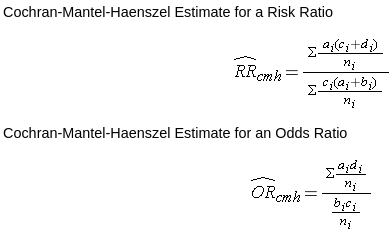
Though, in practice we just have the computer solve for MH estimates.
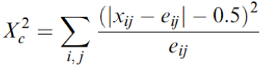
Continuity Corrections
Chi-Squared distributions are continuous whereas some variables are categorical, therefore we must correct by adding or subtracting .5. The "corrected" result is more accurate. This is often used when there are small samples or 0's in some cells.
Fisher's Exact Test
When a single epected value is small (n<5) a continuity correction only helps so much. In such cases we use Fisher's Exact test. Prepare your 2x2 table with the cell containing the smallest number in the upper left corner. Then identify all possible tables with that cell the same as or more extreme than observed and sum the probabilities. This gives the probability of that specific table.
Pr(a,b,c,d) = [(a+b)!(c+d)!(a+c)!(b+d)!] / N!a!b!c!d!
Again, this is usually performed by a computer. In R: fisher.test(Count)
No Comments