Effect Modification and Interaction
Interaction is when a treatment effect is different across different subgroups of the population defined by a baseline covariate. Commonly examined effect modifiers include: demographic variables, study location, or baseline prognostic factors.
If an interaction does exist:
- We may not be able to provide a single summary measure
- A treatment may be beneficial to some subgroups but harmful to others
- We may need to conduce subgroup analyses to identify the treatment effect within each subgroup.
Types of Statistical Interactions
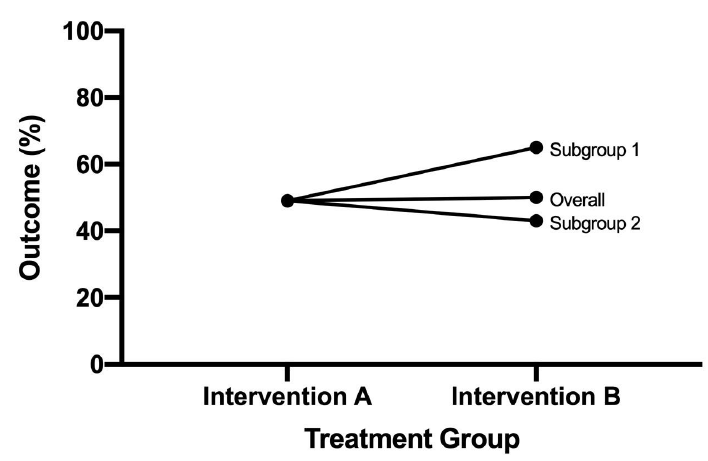
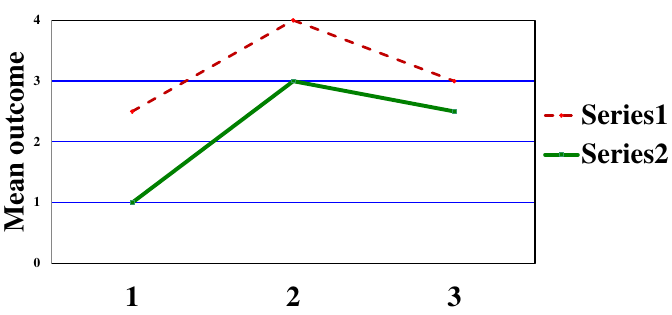
- Quantitative: Direction of the effect of an exposure on an outcome is the same for different subgroups but the size of the effects differs

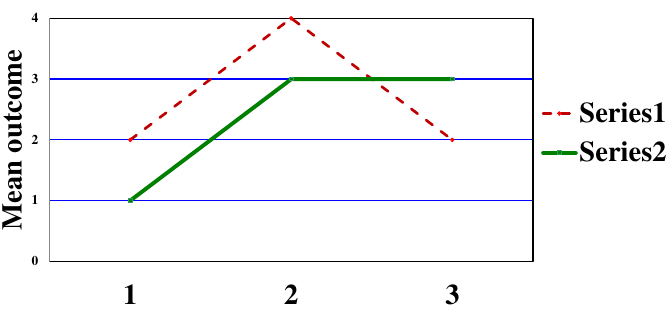
- Qualitative: Direction of the effect of an exposure on an outcome differs for different subgroups

A potential issue that arises with assessing interaction is that the sample size within a subgroup will be smaller than for the whole trial population and there will be less power to detect an effect. To account for this we can adjust the sample size requirement for interactions of interest, or define a limited number of pre-specified exploratory subgroup analyses (multiple testing needs to be accounted for).
Statistical Assessment of Interaction
Interaction F is testing:
H0: No interaction vs H1: Interaction
*Adjusted Treatment Comparison;
proc glm;
class trt sex;
model change=trt sex/solution clparm;
run;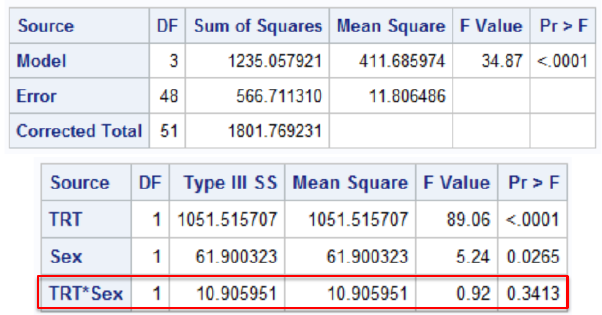
The FDA rule is to assess interactions at .15 level of significance. This is conservative and circumvents low power issues; If the interaction exists it may have a relatively low probability of obtaining a significant interaction result.
Other options:
- Cochran-Mantel-Hansel approach (PROC FREQ)
- Include CMH option in table statement
- Provides 3 types of info:
- Test for interaction by center (Breslow-Day Homogeneity Test)
- The Breslow-Day Test of Interaction tests the null hypothesis that odds ratios across q strata are all equal; Under the null the statistic has a chi-square distribution with q-1 df (strata-1)
- BD test requires large sample size within each stratum
- At least 80% of the expected cell counts should be > 5
- Tarone's modification has slightly more accurate p-values when values are small
- (add bdt to table options)
- Summary measures of association (weighted average of stratum specific OR or RR)
- Test for treatment effect adjusting for center
- Test for interaction by center (Breslow-Day Homogeneity Test)
- Logistic Regression (PROC LOGISTIC)
- Include the interaction term(s) in the model statement
*Cochran-Mantel-Haenszel Approach;
proc freq;
*Order: Factor*Treatment*Outcome;
table center*arm*corabn/cmh;
weight count;
run;

* Assessing treatment-by-center interaction with logistic regression;
proc logistic data=kawasaki;
class arm(param=ref ref='2-ASA') center;
model corabn(event='ABNORMAL')=arm|center /rl;
freq count;
oddsratio arm / at (center=all);
run;
Interpretation
If the interaction is qualitative it would be meaningless to talk about an "overall" treatment difference. We would need to investigate the cause of interaction and if it invalidates the study through subgroup analysis.
If non-significant or quantitative we can "ignore" interaction (remove from model assessing treatment effect)
When an interaction term is present, the main effects alone cannot be interpreted without being relative to the state of other variables.
Dummy Variable Approach to Interaction
![]()
In SAS we represent interaction in a regression model using binary variables.
*Code Binary Variable;
data dbp;
set dbp;
*Dummy variables;
if sex='F' then new_sex=1;
else new_sex=0;
if trt='A' then new_trt=1;
else new_trt=0;
*Interaction term(s);
trt_sex=new_trt*new_sex;
run;

*Model with interaction;
proc reg data=dbp;
model change=new_trt new_sex trt_sex;
*Test for interaction;
INTERACTION: test trt_sex=0;
run;
No Comments