Layouts and Structured Data
Now that I've covered the basics of programming in D3, let's take a look at some of the other cool things one can build with D3. Before jumping into the code, it's worth mentioning the resources available within the D3 community for sharing reusable code. As of writing this there are sites like VisHub or the D3 Graph Gallery which contain some commonly used D3 code snippets.
Also, this guide mostly follows version 7 as it is the latest . Sometimes libraries are slow to update documentation examples so it is important to read the change log when trying to upgrade D3.
Layouts
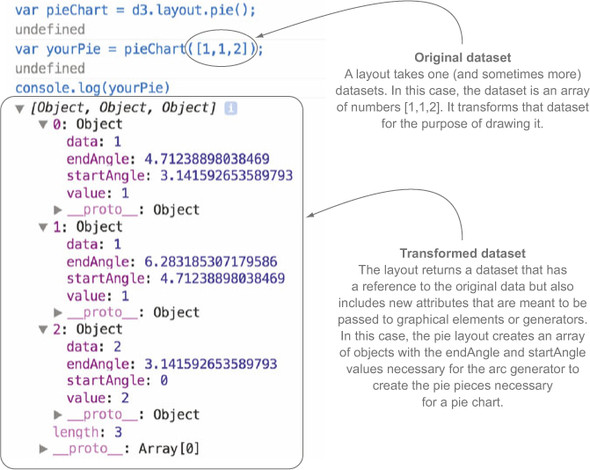
Layout functions format the data to include attributes that allow for drawing the data.
I found the below visualizations here and here, but note it uses D3 v3 syntax, for v4+ we would just use d3.pie() rather than d3.layout.pie()
Other layouts include:
- d3.force() - Nodes are represented as circles and edges/link/connections as lines (more on this below)


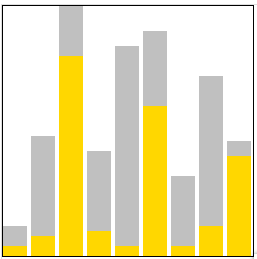
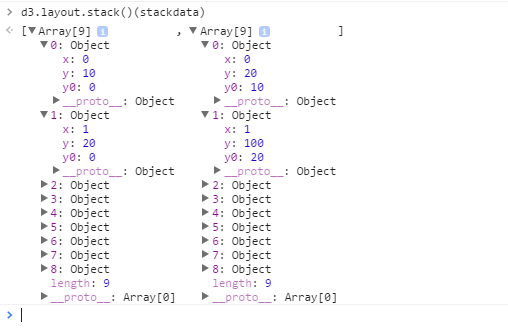
- d3.stack() - Good for illustrating how ratios compare over time


Choosing the Right Data Structure
There are cases where the above functions expect data in a certain format, that being either an Array or Object (map).
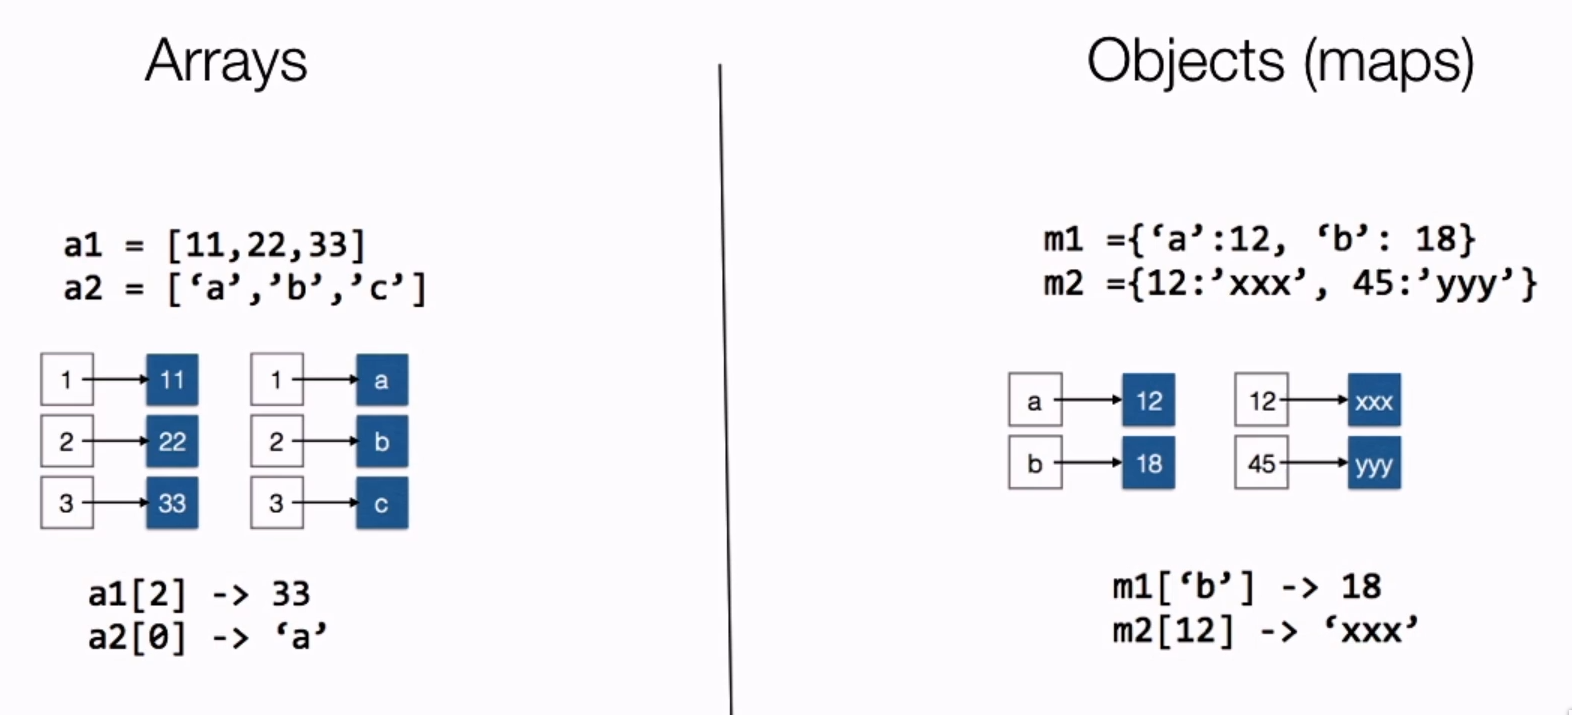
The advantage with Maps is we can find a key without the index or searching the entire data structure. In D3 we often work with Arrays of objects, which is good for looping over objects but can make searching for a field within an object cumbersome. The D3 group(), or groups() function (previously known as nest()) can create a map of JS objects based on a category.
Maps
The first step towards creating a visualization of a region is finding the map file to use, containing information about borders and locations. There several places online that can create files for this purpose, the most popular format being GeoJSON and D3.geoPath(). Another format is TopoJSON which also encodes topology, and are usually smaller than GeoJSON even though they include more data.
When building maps converting a sphere to a 2D surface can be problematic. To get the map to fit nicely to the screen we often apply some kind of projection that stretches the areas nearer to the poles, making them appear larger than they actually are. In D3 we have the flexibility to choose the projection we want to use with our maps.
    var width = 600,
        height = 400;

    var projection = d3.geoConicEqualArea()
        .scale(153) // How much to zoom in
        .translate([width / 2, height / 2]) // Center the map
        .precision(.1);

    var path = d3.geoPath()
        .projection(projection); // Define the path and attach projection

    var graticule = d3.geoGraticule(); // The coordinate lines on the map

    var svg = d3.select("body").append("svg")
        .attr("width", width)
        .attr("height", height);

   d3.json("data/world-110m.json").then(function(world) {

        svg.append("path")
     		// Land borders for the map
            .datum(topojson.feature(world, world.objects.land))
            .attr("class", "land")
            .attr("d", path);

        svg.append("path")
     		// Define borders between countries
            .datum(topojson.mesh(world, world.objects.countries, function(a, b) { return a !== b; }))
            .attr("class", "boundary")
            .attr("d", path);

        svg.append("path")
            .datum(graticule)
            .attr("class", "graticule")
            .attr("d", path);
    });

    d3.select(self.frameElement).style("height", height + "px");
So in the above I use d3.geoConicEqualArea() to get a cone shaped map with actual sizes, the typical projection of the standard classroom world map would be geoMercator() instead. Also, do not use these options if the map data already has a projection.
Loading Multiple Datasets
So now we know how to load map data, but we'll need to load another file with regional information to create useful visualizations. To do this we will learn about Queues (D3 < v5) and Promises (D3 v5+).
Let's say we have a JSON and a csv to load. We might be tempted to write two different data statements or nest them together. Here's the issue:
// METHOD 1 - With a global variable (WRONG)

var mapData, infoData; // Global variables

// Async data loading for json
d3.json("map.json", function(map){
	mapData = map;
})
// Async data loading for csv
d3.csv("info.csv", function(info){
	infoData = info;
})

// Code here to do something with the data
// ISSUE: This gets run immediately even if the above datasets are not initialized

// METHOD 2 - Nested data statements (WRONG)

d3.json("map.json", function(map){
  d3.csv("info.csv", function(info){
      // Code here to do something with the data
  })
})

// ISSUE: This works, but takes a long time bc the page can't start loading the 2nd file before the 1st is done
Now the correct method:
// D3 Queue < V5
d3.queue()
	.defer(d3.json, "map.json")
	.defer(d3.json, "info.csv")
	.await(function(map, info) {
		// Code to do something with both files
     });

// Promises - V5+
var promises = [
 	d3.json("map.json"),
  	d3.csv("info.csv")
]

Promises.all(promises).then(function(allData) {
  var map = allData[0];
  var info = allData[1];
  // Code to do something with both files
}).catch(function(error) {
  console.log(error);
});
Networks
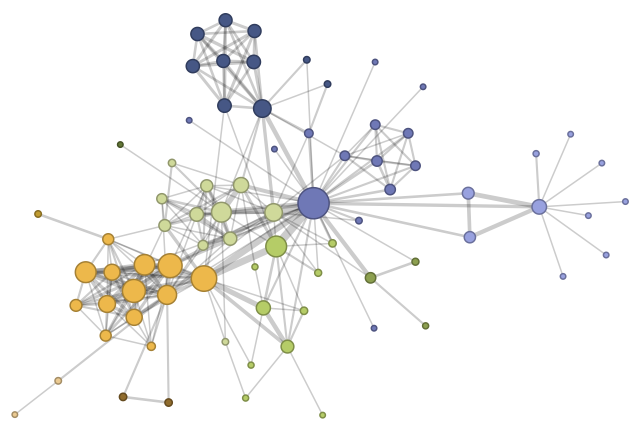
The d3.force layout allows us to create a physics simulator with elements that attract and repel each other. These are good for visualization relationships between elements and grouping elements around a central point.
There is a general process to follow when creating a visualization with d3.force:
- Initialize the force simulation
- Add force functions to the system
- Create a callback function to update SVG positions after every "tick"'
// Add "forces" to the simulation
var simulation = d3.forceSimulation()
// Define center of gravity
.force("center", d3.forceCenter(width / 2, height / 2))
// Making elements attract or repel
.force("charge", d3.forceManyBody().strength(-50))
// Prevent elements from overlapping
.force("collide", d3.forceCollide(10))
// Creates fixed distance between connected elements
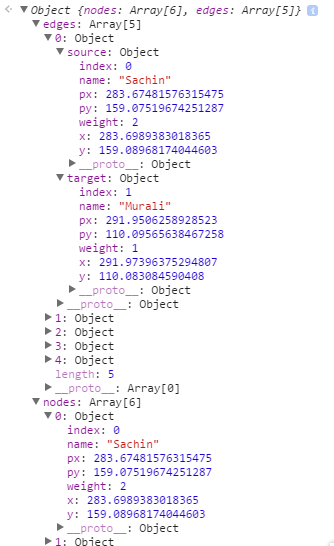
.force("link", d3.forceLink().id(function(d) { return d.id; }))
// Data elements
.nodes(graph.nodes)
.on("tick", ticked);
// Fire on every tick of the clock to update
function ticked() {
link
.attr("x1", function(d) { return d.source.x; })
.attr("y1", function(d) { return d.source.y; })
.attr("x2", function(d) { return d.target.x; })
.attr("y2", function(d) { return d.target.y; });
node
.attr("transform", d => `translate(${d.x}, ${d.y})`);
}These graphs are fun way to illustrate relationships between a network while also facilitating user engagement.
Hierarchical Data
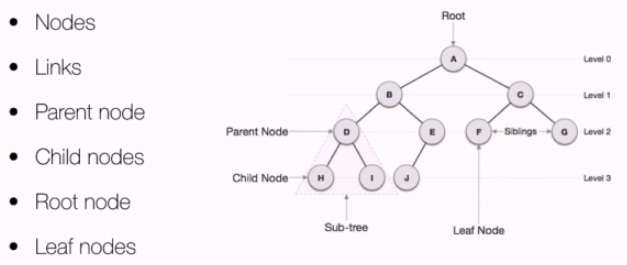
Now let's consider data that belongs to a system in which elements belong to other elements, such as a typical corporate hierarchy from CEO down. There's a lot of synonymous terminology that can be used with tree charts, here is what we'll be using:
Our data must have a "root" node in the right format; d3.hierarchy or d3.stratify can be used to convert a JS Object. Using hierarchy, every node and descendant must have the following properties:
- node.data - the associated data as passed to hierarchy
- node.depth - zero for the root, increasing by one for each descendant generation
- node.height - the greatest distance from any descendant leaf, or zero for leaves
- node.parent - the parent node, or null for the root node
- node.children - an array of child nodes, if any, or undefined for leaves
- node.value - the optional summed value of the node and its descendants
If there is no existing structure to the data we can use stratify to define it:
const root = d3.stratify()
    .id((d) => d.name)
    .parentId((d) => d.parent)
  (table);
Once we have the data in the proper format we can represent the data as:
- Tree Diagram/Map
- Packed cirlces
- Sunburst charts
d3InDepth has a great section on this
No Comments