Data Driven Documents
Introduction
D3 is a JS library which can be used to create charts and visualiztions, but to call it a "charting" library is an understatement. It provides tools for manipulating SVG/HTML and manipulating data. It's 'low-level' nature allows users to customize and create complex visualizations with dynamic and interactive content. However, this also gives it a steep learning curve. I would encourage readers to consider the complexity of the task they are trying to achive and whether it would be more practical to use chart.js or plotly.
Credit to the following for helping me build this tutorial:
- Mastering data Visualization in D3.js - I followed this udemy course, worth $10
- D3 in Action - Probably the best textbook on D3 out there. They have an old edition for free on their website, it uses an older version of D3 but the fundementals are the same
- D3InDepth - Great tutorials with D3 v6 and 7
- D3 Getting Started Guide - The official documentation, I don't love the order it presents information
- D3 Graph Gallery - D3 templates and example code
Find the full code examples in this course on my github.
Setting Up
The <script> tag used to download the latest release can be found on the D3 Homepage
WebStorm from Jetbrains is my personal choice for JS development as it contains an http-server for viewing changes instantly. Visual Studio Code from Microsoft is also very popular.
If not included in your IDE, it is also helpful to have a simple HTTP Server to run html. Python has a built-in http server, so if you have python it's an easy option with no additional packages needed. In the terminal go the directory where the files you want to host are and run:
python -m http.server 9000
Alternatively, npm also has an http server that reloads changes automatically, but it needs to be installed:
npm install -g http-server
Then it can be run with http-server
Understanding the Scaleable Vector Graphics
SVGs allow us to draw shapes with code on a coordinate grid. The markup code is very similar to HTML, and file sizes are small.
You can create an SVG in HTML with the <svg> tag and define the demensions of the canvas. By default the Top Left of the canvas is (0,0) and Botton Right is (x, y) where x is max width and y is max height. This can be changed with the "text-anchor" attribute. Below are some examples embedded in HTML:
<svg width="400" height="60">
	<!-- "x" and "y" coordinates give a shape its position (top left hand corner) -->
	<rect x="0" y="0" width="50" height="50" fill="green"></rect>
	<!-- For circles, choose the center with "cx" and "cy", and the radius with "r" -->
	<circle cx="90" cy="25" r="25" fill="red"></circle>
	<!-- Ellipses are similar, but they take "ry" and "rx" attributes -->
	<ellipse cx="145" cy="25" rx="15" ry="25" fill="grey"></ellipse>
	<!-- Lines need two pairs of coordinates and a stroke width -->
	<line x1="185" y1="5" x2="230" y2="40" stroke="blue" stroke-width="5"></line>
	<!-- Text takes an x/y coordinate and a font size -->
	<text x="260" y="25" font-size="20px" fill="orange">Hello World</text>
</svg>
<div>
	<svg width="190" height="160" xmlns="http://www.w3.org/2000/svg">
		<path d="M10 80 C 40 10, 65 10, 95 80 S 150 150, 180 80" stroke="black" fill="transparent"/>
	</svg>
</div>
When working in D3 this would be normally implmented within Javascript, as large projects would become very hard to read if we embedded everything in HTML.
D3 Basics
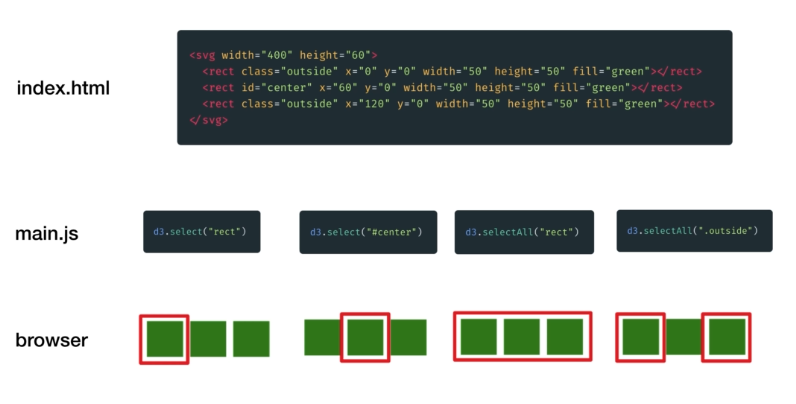
D3 Select Uses CSS Selectors to return page elements similar to JQuery, then we can use D3 commands such as binding data to shapes. Below demonstrates how selecting works:
// 1. Select the SVG image
const svg = d3.select("#canvas")
// 2. Append Something to it
const rect = svg.append("rect")
// 3. Set Attributes
rect.attr("x", 25)
rect.attr("y",0)
rect.attr("width", 150)
rect.attr("height", 150)
rect.attr("fill", "blue")
It is cleaner to use method chaining:
const svg = d3.select("#canvas")
  .append("rect")
    .attr("x", 25)
    .attr("y",0)
    .attr("width", 150)
    .attr("height", 150)
    .attr("fill", "blue")
Binding Data to Shapes
I'll go into more detail about data binding later, but for now recognize the enter() function binds data to a selected SVG. We can set attributes to be functions of the data:
const svg = d3.select("#chart-area").append("svg")
    .attr("width", 400)
    .attr("height", 400

const data = [25, 20, 15, 10, 5]

const circles = svg.selectAll("circle")
    .data(data)

// Create circle of various sizes and space them out evenly
circles.enter().append("circle")
    .attr("cx", (d, i) => {
        console.log("Item: " + d, "Index: " + i)
        return (i * 50) + 50
    })
    .attr("cy", 250)
    .attr("r", (d) => d)
    .attr("fill", "red")
Loading External Data
Data usaully comes in one of 3 formats:
- Comma Seperated Values (CSV)
name, age
Tony, 10
Mitch, 26
- Tab Seperated Values (TSV)
name	age
Tony	10
Mitch	26
- JavaScript Object Notation (JSON)
{
	{
    	"name": "Tony",
        "age": "10"
    },
    {
    	"name": "Mitch",
        "age": "26"
    }
}
All of these are loaded similarly and are always converted into JSON format:
d3.csv("data/ages.csv").then(data => {
	console.log(data)
	// Code goes here
})
Replace csv with the data format, you can use a relative or absolute path. The function returns a promise so we can pass the value around the code without waiting for it to evaluate.
No Comments