Dynamic and Interactive Content
Thus far we've looked at building static content, but the backbone of D3.js are it's beautiful transitions and dynamic updating capabilities.
Intervals
We need some way of repeatedly running code to change something the chart reacts to. The easiest way to do this in d3 is using an interval.
const myInterval = d3.interval(() -> {
 	// code to loop
}, 500) //runs every 500ms

clearInterval(myInterval) // stop loop
The D3 Update Pattern
Let's debug the following code to observe how D3 objects work:
// JOIN data to create d3 virtual selectors
const rects = g.selectAll("rect")
      .data(data)

console.log(rects)

// EXIT - Old Elements
rects.exit().remove();

// ENTER - new elements onto the page
rects.enter().append("rect")
      .attr("y", d => y(d.revenue))
      .attr("x", (d) => x(d.month))
      .attr("width", x.bandwidth)
      .attr("height", d => HEIGHT - y(d.revenue))
      .attr("fill", "grey")

// UPDATE as needed
rects.attr("fill", "blue")

console.log(rects)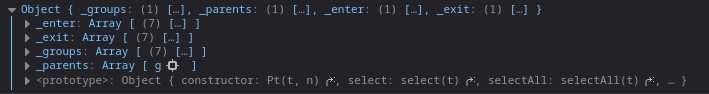
We now have an object with _enter, _exit, _groups and _parents. _enter contains elements in our data array that don't exist on the page (the shapes that need to be 'entered' on the screen). _exit is elements that are on the page but not in our data array (elements to be removed from the screen). _groups represents all elements that exist on the screen.
We always want to use the same update pattern when our data changes:
- Data Join - select all matching elements on the screen with selectAll() and update the data we're using
- Exit - Use the exit() selector to remove the elements that don't exist in our new array of data
- Update - set attributes for existing elements on screen
- Enter - use the enter() selector to set attributes for new items in our data array
Transitions
To give smooth updates, we can use the d3 transition suite. Which can be added with the following line:
rects.enter().append("rect")
      .attr("x", (d) => x(d.month))
      .attr("width", x.bandwidth)
      .attr("height", d => HEIGHT - y(d.revenue))
      .attr("fill", "grey")
      .transition(d3.transition().duration(500)) // gradually apply over 500ms
        .attr("y", d => y(d[value]))
Transitions are applied over time to each dynamic element of the graph. We can also define the transition as a variable so we don't have to write out d3.transition() over again. Always keep the transition length smaller than the loop's delay.
We can make the transitions even smoother by adding a exit transition and specifying the initial values before the transitions.
update(data) {
  ...

  const t = d3.transition().duration(500)

  rects.exit()
      .attr("fill", "red")
      .transition(t)
      .attr("height", 0)
      .attr("y", y(0))
      .remove()

  rects.transition(t)
      .attr("y", d => y(d[value]))
      .attr("x", (d) => x(d.month))
      .attr("width", x.bandwidth)
      .attr("width", x.bandwidth)
      .attr("height", d => HEIGHT - y(d[value]))

  rects.enter().append("rect")
      .attr("x", (d) => x(d.month))
      .attr("width", x.bandwidth)
      .attr("height", d => HEIGHT - y(d[value]))
      .attr("fill", "grey")
      .attr("fill-opacity", 1)
      .attr("y", y(0)) // Starting y axis
      .attr("height", 0) // Starting height
      .transition(t)
        .attr("y", d => y(d[value]))
        .attr("height", d => HEIGHT - y(d[value]))
}
D3 Merge Method
You'll notice in the last code chunk the update and enter statement are somewhat repetitive. This can be resolved with the merge method.
  rects.exit()
      .attr("fill", "red")
      .transition(t)
      .attr("height", 0)
      .attr("y", y(0))
      .remove()

  rects.enter().append("rect")
      .attr("fill-opacity", 1)
      .attr("y", y(0))
      .attr("height", 0)
      // UPDATE is now part of transition
      .merge(rects)
      .transition(t)
        .attr("width", x.bandwidth)
        .attr("fill", "grey")
        .attr("x", (d) => x(d.month))
        .attr("y", d => y(d[value]))
        .attr("height", d => HEIGHT - y(d[value]))
By default, d3 assumes the elements between data arrays stay in order. Let's say the first dataset is missing the first element, to resolve this we can add an argument to the data function to choose a key between different arrays.
A Note of .attr vs .style
	legendRow.append("text")
    .attr("x", -10)
    .attr("y", 10)
    .attr("text-anchor", "end")
    .style("text-transform", "capitalize")
    .text(continent)
The style method is used to set css styles of svgs. Sometimes styles can also be attributes, such as fill, capacity, stroke width. Sometimes they can be use interchangeably but in cases like text-transform .style must be used.
D3 Formats and Parsing
d3.format(".0%")(0.123);  // rounded percentage, "12%"
d3.format("($.2f")(-3.5); // localized fixed-point currency, "(£3.50)"
d3.format("+20")(42);     // space-filled and signed, "                 +42"
d3.format(".^20")(42);    // dot-filled and centered, ".........42........."
d3.format(".2s")(42e6);   // SI-prefix with two significant digits, "42M"
d3.format("#x")(48879);   // prefixed lowercase hexadecimal, "0xbeef"
d3.format(",.2r")(4223);  // grouped thousands with two significant digits, "4,200"

const formatter = d3.format(".2f")

formatter(1000) // 1000.00
formatter(5.248) // 5.25
formatter(30.1) // 30.10
We can define a format and call as a function to return more human readable numbers. We can even add custom specifiers to specify sign, symbol, commas, and precision. The full list of rules can be found here. There are separate methods formatTime and parseTime to work with times.
Tool Tips
Tooltips were added by a member of the D3 community in the d3-tip library. The library needs to be installed separately. It can be used to let the user view the data within an SVG. They are implemented as follows:
- Initialize the tooltip element
Create the tip, assign a class for styling, and then setting the content of the tooltip with the html function.tip = d3.tip().attr('class', 'd3-tip').html(function(d) {return d;}); - Invoking the tip in the context of the visualization
Let the page know we want to attach the tooltip to the svg area.vis.call(tip) - Adding Event Listeners and Handlers
The 'on' method is used to attach events to SVGs. The two arguments are the type of event and function to execute.vis.selectAll('rect') .data(data) .enter() .append('rect') .attr('width', function { return x.rangeBand() }) ... .on('mouseover', tip.show) .on('mouseover', tip.hide)
The alternative is adding the tooltip as a div:
var tooltip = d3.select("body")
    .append("div")
    .style("position", "absolute")
    .style("z-index", "10")
    .style("visibility", "hidden")
    .style("background", "#000")
    .text("a simple tooltip");

d3.select("body")
  .selectAll("div")
    .data(data)
  .enter().append("div")
    .style("width", function(d) { return x(d) + "px"; })
    .text(function(d) { return d; })
    .on("mouseover", function(d){tooltip.text(d); return tooltip.style("visibility", "visible");})
      .on("mousemove", function(){return tooltip.style("top", (d3.event.pageY-10)+"px").style("left",(d3.event.pageX+10)+"px");})
      .on("mouseout", function(){return tooltip.style("visibility", "hidden");});
Event Handlers and Listeners
For making our visualizations more interactive we can add event handlers to the svg. The following code utilizes the jQuery to select items from the screen and add the event handler. The slider requires the separate jQuery UI package.
<button id="reset-button" class="btn btn-primary">Reset</button>
<div id="slider-div">
	<label>Year: <span id="year">1800</span></label>
	<div id="date-slider"></div>
</div>
// jQuery
$("#reset-button")
.on("click", () => {
currentYear = 1800
update()
})
// jQuery UI
$("#date-slider").slider({
min: 1800,
max: 2014,
step: 1,
slide: (event, ui) => {
currentYear = ui.value
update()
}
})Since D3 is a JS library, we could combine it with a framework instead of jQeury to meet the same results. D3 can be easily integrated into Angular or React web apps. It can also work in tandem with statistical programming languages like Python and R (with R Shiny).
No Comments