Poisson Regression
We use the Poisson Regression to model a risk ratio when we are interested not in whether something occurs but how many times it occurs; Either repeated events or events in a population.Ex. number of hospitalizations, number of infections, etc.
Logistic regression produces odd ratios (which approximates risk ratio when outcome is rare), but only analyzes patients with at least 1 event and can be difficult to interpret when outcome is not rare. Survival analysis can be used to analyze the time to the first event.
Poisson Distribution
- X ~ Poisson(μ); μ > 0
- X = the number of occurrences of an event of interest, with parameter μ
- Probability mass function
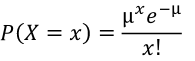
- E(X) = μ
- V(X) = μ
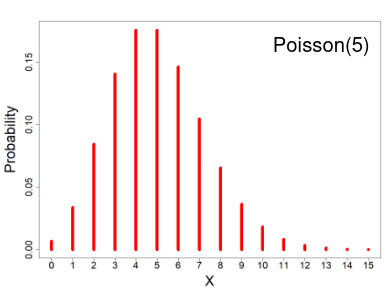
The distribution depends of the expected number of events, since the mean = variance. As the number of expected number of events increases it the more closely the Poisson distribution approximates the normal distribution.
If X ~ Binomial(n, p) and n -> inf, p -> 0 such that np is constant; X ~ Poisson(np)
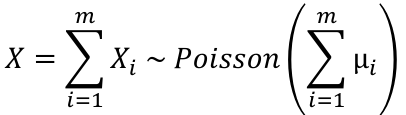
Distribution of the sum of independent Poisson random variables. If Xi ~ Poisson(μi) for i = 1 to m, and teh Xi's are independent then: