Model Fit & Concepts of Interaction
Review of Logistic and Proportional Hazards Regression Model Selection:
You can look at changes in the deviance (-2 log likelihood change)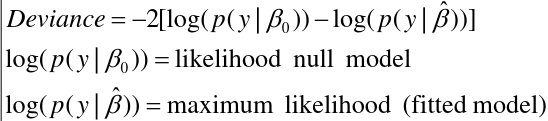
- Deviance - Residual sum of squares with normal data
- Problem: Deviances alone do not penalize "model complexity" (hence need LRT - but
onluonly applies to nested models)
- Problem: Deviances alone do not penalize "model complexity" (hence need LRT - but
- AIC, BIC - More commonly used
- Larger BIC and AIC -> worse model
- BIC is more conservative
- Both based on likelihood
- An advantage is that you do not need hierarchical models to compare the AIC or BIC between models
- A disadvantage is there is no test nor p-value that goes with comparison of models
- A model with smaller values of AIC or BIC provides a better fit
- Used to compare non-nested models
- A non-nested model refers to one that is not nested in another; The set of independent variables in one model is not a subset of the independent variables in the other models
- The data must be the same
Risk Prediction and Model Performance
How well does this model predict whether a person will have the outcome? Generally only for dichotomous outcomes, especially in genetics.
- Calibration - Quantifies how close predictions are to actual outcomes - goodness of fit
- Models for which expected and observed event rates in subgroups are similar are well-calibrated
- Discrimination - The ability of the model to distinguish correctly between the two classes of outcome
Logistic
- A model that assigns a probability of 1 to all events and 0 to non-events would have perfect calibration and discrimination
- A model that assigns a probability of .51 to all events and .49 to all non-events would have perfect discrimination and poor calibration
Hosmer-Lemshow Test
The Hosmer-Lemshow Test is a statistical goodness of fit test for logistic regression models. It is frequently used in risk prediction models. It assesses whether or not the observed event rates match expected event rates in subgroups of the model population of size n. Specifically, it identifies subgroups as the deciles of size nj based on fitted risk values.
H0: The observed and expected proportions are the same across all groups
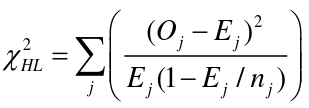
- Oj and Ej refer to the observed events and expected events respective in the jth group
- nj refers to the number of observations in the jth group
- Sensitive to small event probabilities in categories
- Sensitive to large sample sizes
- Problems: Results immensely depend on the number of groups and there is no theory to guide the choice of that number. It cannot be used to compare models.
R Code
library(effects) # To plot interactions
library(survival) # load survival package

# Hosmer-Lemshow Test
mod <- glm(y~x, family=binomial)
hl <- hoslem.test(mod$y, fitted(mod), g = 10)