Association Testing in Unrelated Individuals
In association testing we are interested in the effect of a specific allele in the population. We ask the question: "Is allele X1 more common in affected individuals than unaffected individuals?" We do not need family data to answer this, but we can use it if we have it.
Recall that Linkage Disequilibrium is the tendency for alleles at two loci closely linked on a chromosome to be associated in a population. Linkage is done within a family (referring to alleles inherited together), and LD is done within a population (alleles found at two loci together on a haplotype more often than expected). After many generations disease causing mutations in LD will fadechange due to recombination.
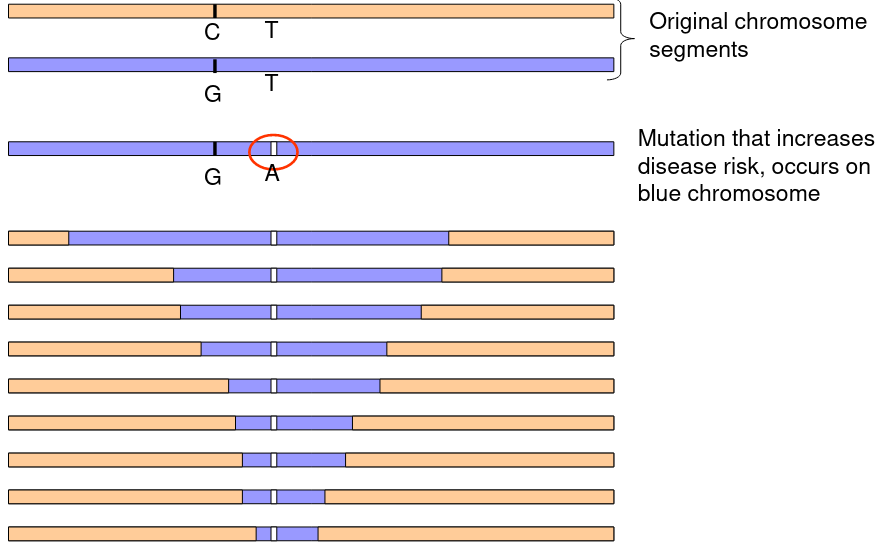
The above graphic represents a mutation on a chromosome that decreases over generations.
Specific alleles may be functional or in LD with functional mutations.
Functional = casual -> the mutation that actually causes the increased/decreased risk/phenotype.
Genetic Association Testing
In genetic association analysis, we are trying to identify association between genotype/marker (SNP) and phenotypes.
H0: No association between marker genotypes and phenotype
When the null hypothesis is rejected, we conclude a marker is associated with a phenotype.
- The marker may be a functional mutation or in LD with a functional mutation
- Non-synonymous changes, truncation, UTR SNPs may be more likely to be causal ("functional SNPs")
- Synonymous, intronic, IVS SNPs may be less likely to be casual
- Functional studies are usually required to determined whether an associated SNP is functional/casual
- Databases such as ENCODE make it easier to predict if variants have function but its still difficult to be sure for non-exonic variants
Association Testing for Qualitative Traits
- Can be performed within case-control or cohort/population studies
- Case-control commonly used for genetic studies of rare traits
- H0: there is no association between alleles
- Testing methods:
- Chi-square (or Fishers
exactexact) test comparing allelic or genotypic frequencies between cases and controls- X2 = sum((Oi - Ei)^2/Ei)
- DF = number of genes compared - 1
- Logistic regression
- Allows incorporation of covariates
- Convenient framework for exploration of genetic models
- For matched case-control studies can perform MH test, conditional logistic regression
- Chi-square (or Fishers
Logistic Regression
Best for regression under a dichotomous outcome (affected/unaffected), when linear regression is not appropriate. We want the response (dependent variable) Y to have two possible values, 1 for effected or 0 for non-effected. A regression equation can predict a number between 0 and 1 that could be interpreted as the probability of being affected or the log odds of being affected. Regression coefficients are the log odds ratios for each of the independent variables.
The linear logistic model has the form: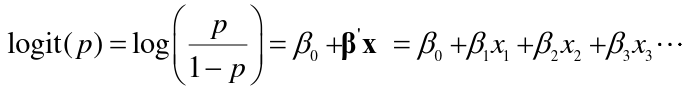
For a dichotomous predictors the beta parameters in a logistic regression are the log-odds ratios for a disease for those with a risk factor (x = 1) vs those without (x = 0)
For a continuous or ordinal predictor, the parameters are log-odds ratios for a one unit increase in x.
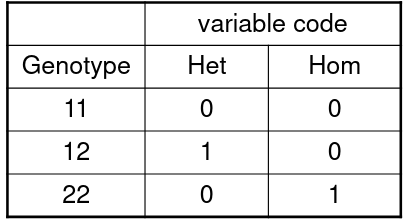
Coding Genetic Variables
We are interested in evaluating if the genotype at a specific marker is associated with being effected by a phenotype. Concider a SNP with alleles 1 and 2. We have 3 genotypes: