Midterm Cheat Sheet
|
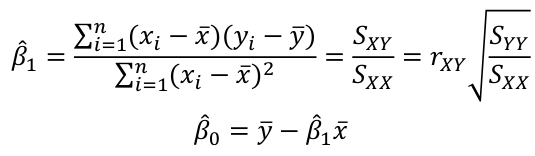
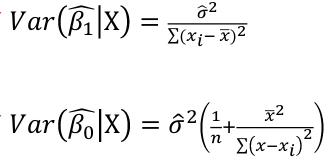
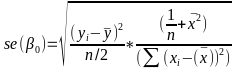
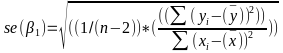
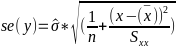
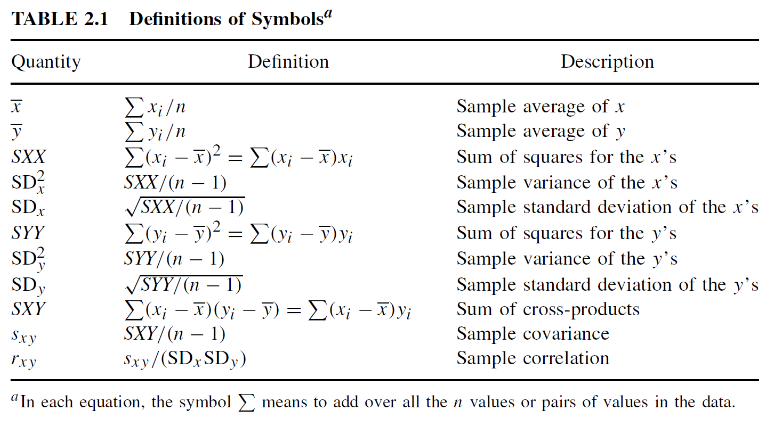
Linear Regression
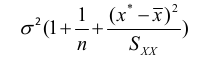
Predicting a CI new obs adds a 1 to se(y): 𝛽0 + 𝛽2x +/- |
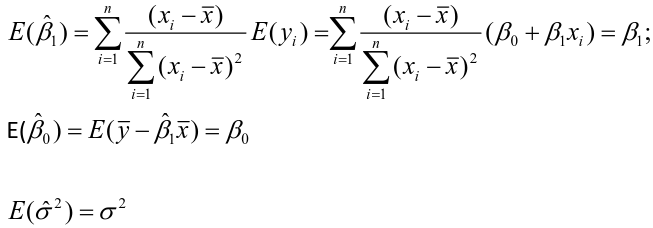
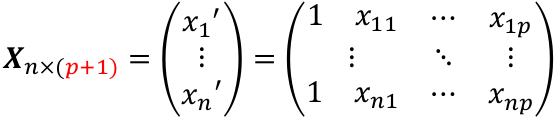
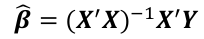
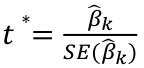
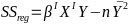
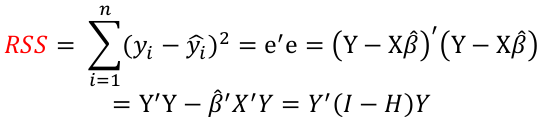
Multiple Linear Regression and Estimation
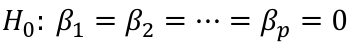
𝐻0 : 𝛽1 = 𝛽2 = 𝛽3 = ⋯ = 𝛽𝑝 = 0
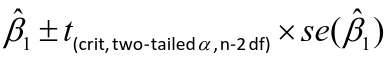
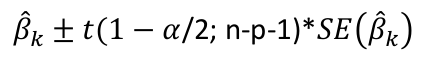
rejection rule of 𝑡 >= t(1 − alpha/2; 𝑛 − 𝑝 − 1)
|
|
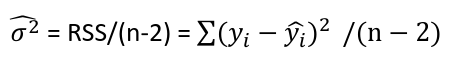
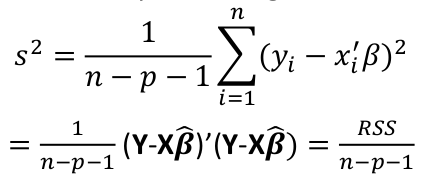
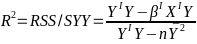
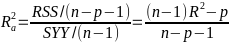
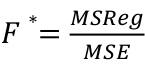
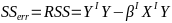
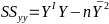
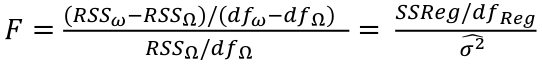
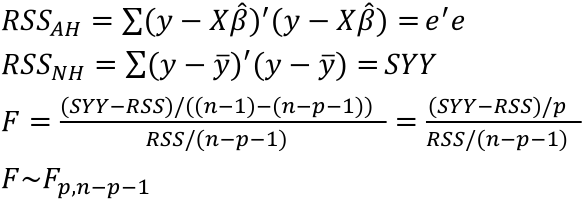
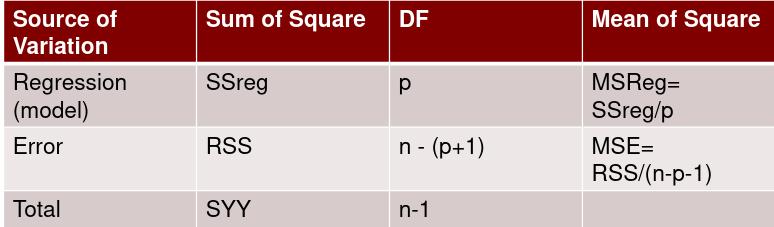
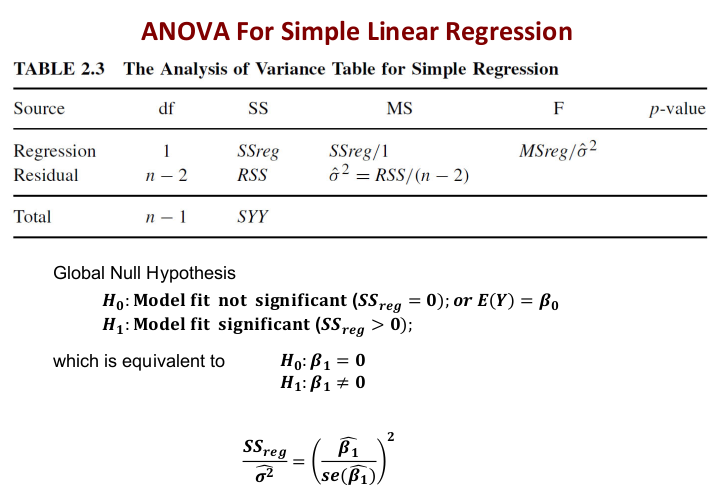
Model Fitting: Inference
dfΩ = n - p, and df𝜔 = n – q
Reject the null hypothesis if F > Fα p - q, n – p
|
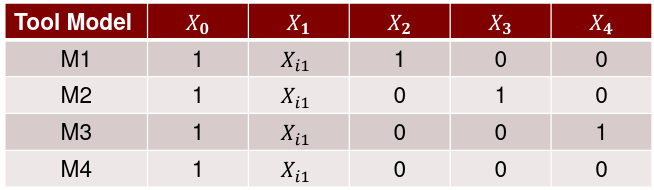
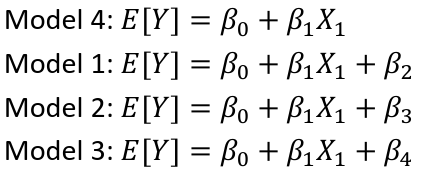
Dummy Variables and Analysis of Covariance
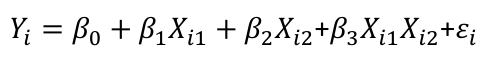
An interaction between Xi1 and Xi2:
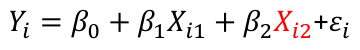
A model with multiple categorical variables:
|
|
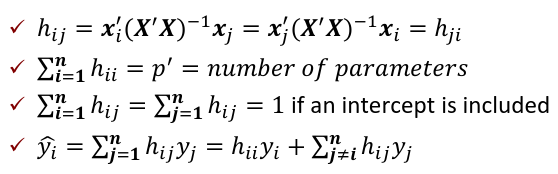
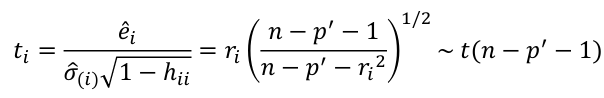
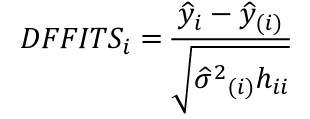
Regression Diagnostics
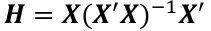
The Hat Matrix – n*n matrix
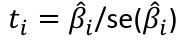
Calculate the t-test and compare abs with limit: |
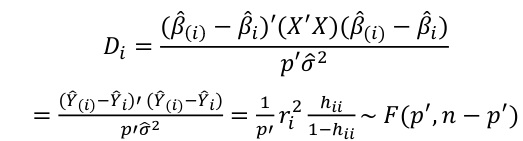
Influential Points: causes changes to regression
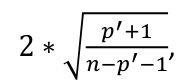
with a threshold of
Where p’ is the number of parameters Cook's Distance:
with a threshold of Error: a plot of e_hat should |