Evidence-Based Public Health
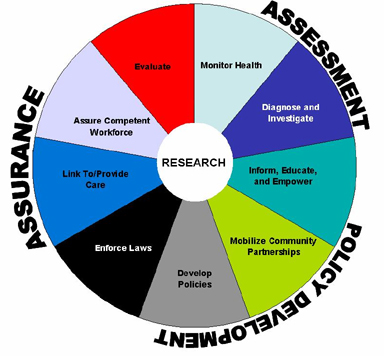
Maximizing the health of a population is largely achieved through three core functions of public health; Assessment, policy development, and assurance. Within each core function lies a subset of the 10 essential functions of public health:
As mentioned in the the previous module on ethics, it is essential to consider alternative courses of action to maximize benefit, minimize adverse consequences and make the most efficient use of scarce resources. As a result decisions on how to address public health must be evidence-based, meaning they are based on accurate and complete data which have been rigorously analyzed.
Two broad types of evidence are essential to the practice of public health:
- The Evidence regarding the efficacy and adverse consequences of interventions
- Evidence regarding the determinants of health and disease
In addition, it is useful to have evidence regarding how a disease spreads across a population, including social and political factors. Ex. are there members of the population at higher risk due to behavior, age, preexisting conditions or geography?
Even though most research depends on quantitative data, a fine understanding usually requires qualitative data.
Learning Objectives:
- Describe the general steps involved in identifying and addressing public health problems
- Describe and give examples of the role of surveillance systems in public health
- Explain what is meant by the term "notifiable/reportable disease"
- Describe the breadth of modern public health surveillance systems and give specific examples
- Define "syndromic surveillance" and explain how it can be advantageous over regular surveillance
- Explain how the characteristics of person, place, and time are used to formulate hypotheses in acute disease outbreaks and in studies of chronic diseases
- Distinguish among case reports, case series, cross-sectional surveys, and ecological studies and explain their importance
- Explain the concept of ecologic fallacy
- Describe the difference between descriptive and analytic epidemiologic studies
- Define and explain the distinguish between retrospective and retrospective cohort studies
- Define and explain features of a case-control study
- Explain and distinguish features of of an intervention study (clinical trial)
- List and define 3 major threats to validity in analytical studies
- Describe the contribution of quantitative and qualitative research to public health
Four Steps
Rothman summarized the four steps to public health approach as followed:
1. Identifying the Problem
In the US there are number of ways in which public health problems are identified:
- Surveillance systems monitor and record occurrences of specific infectious diseases, and information is communicated from municipalities or counties to state health departments and then federal agencies
- States maintain cancer registries
- Computerized registries are increasingly used for diseases like diabetes, kidney failure, and a variety of other problems
- Vital statistics regarding births, deaths, marriages, and divorces are collected by each state and other jurisdictions and through co-op agreements that data is shared with the US National Vital Statistics System
- Many federal agencies periodically conduct surveys to monitor health status of the population
- Health care providers report new or unusual problems to health departments and disseminate findings in the form of case reports or case series
- Local and federal organizations and systems are in place to inspect food and monitor water quality
2. Identifying Contributory Causes
Epidemiology is a discipline that studies the distribution of health outcomes and its possible determinants in populations in order to identify casual associations. Epidemiology us described as the basic science of public health, because it is based in scientific method and identifies factors associated with health states by systematically collecting, analyzing and interpreting quantitative data.
3. Identifying What Works
This is also largely achieved through quantitative methods that evaluate the efficacy of interventions through clinical trials and program evaluation.
4. Identifying the Means
This may rely on quantitative methods, but increasingly relies on qualitative research which aims at understanding people's perceptions and developing an understanding of why they believe what they do. Ex interviewing a key informant to see why a particular intervention did or did not work in order to improve future programs.
Surveillance Systems
Surveillance for public health is based on a variety of data sources that track health status and health-related behaviors in a population over time in order to identify new problems, such as infectious disease outbreaks. In addition to monitoring trends these data help identify new health problems and provide clues about the causes of new issues in a population. Surveillance data enables us to:
- Monitor and report on the health status and health related behaviors in a population
- Identify emerging health problems
- Alert us to potential threats
- Establish public health priorities for a population
- Evaluate the effectiveness of intervention programs
- Explore potential associations between risk factors and health outcomes in order to generate hypotheses about the determinants of disease
Passive Surveillance
Routine reporting of health data. Can create a full picture when combined but is limited by under-reporting.
- Hospital Data
- Disease registries
- Notifiable diseases - Some countries have laws which list diseases which are required to report
Active Surveillance
Actively sought out information:
- Active case finding
- Testing blood markers
- Community Surveys
Sentinel Surveillance
A group of selected institutions or groups pool health data together on a certain disease. This can be used to monitor disease outbreaks and trends, but is unable to detect cases outside sites/groups making it ineffective for rare diseases.
Rumor Surveillance
Relies on unofficial sources of information (blogs, social media, hearsay, etc.). It might alert authorities to investigate further for signs of an outbreak.
Syndromic Surveillance
Monitors for non-specific illness syndromes recorded at medical clinics, along with tells like medicine purchases or absenteeism from school or work. Allows for early identification and can rely on automatic reporting methods. A "syndrome" is a cluster of signs and symptoms.
Other Types
- ProMED - Web-based
- GPHIN - Early warning tool to monitor significant health events
Characteristics of a Good Surveillance System (from CDC)
- An integrative approach uses all available information and provides the best overall picture of health
- It has simple, clearly defined objectives
- The data should be complete and accurate
- The plan should be flexible without incurring additional costs
- Accepted by people and organizations involved in public health surveillance
- Sensitive and Positive Predictive Value (PPV), it should pick up most if not all cases of the disease in the population
- It accurately measures what it intends to measure
- Timeliness to leave room for action
- Stable and available when needed
And all surveillance systems should be evaluated on their effectiveness and if they meet public health functions
Data Sources
There are many sources of data that are useful for monitoring health of the populations and exploring disease frequency over time. Ex:
- Census and Records - US Census and US National Vital Statistics System and the Massachusetts Registry of Vital Statistics and Records
- Disease registries - Massachusetts Cancer Registry, ALS Registry
- Hospital Discharge Registries
- Community Health Information - In MA the Community Health Information Profile (MassCHIP) provides a dynamic, user-friendly service for obtaining free online access to many health and social indicators. One can obtain community-level data to assess health needs, monitor health status indicators and evaluate health programs.
- Infectious Disease Surveillance - Division of Emerging Infections and Surveillance Services (DEISS)
- Commercial Data - Sale of tobacco, drugs, etc
Reportable Diseases
Each US state designates a specified list of diseases that are required to report by law. The MA Department of Public Health provides a Reportable Diseases web site as an online resource for all public health organizations. This data is fed into the National Notifiable Disease Surveillance System (NNDSS).
Data for selected nationally notifiable diseases reported by the 50 states and D.C. and the US territories are collated and published weekly in the Morbidity and Mortality Weekly Report (MMWR).
Descriptive Epidemiology
Descriptive epidemiology is defined as epidemiological studies and activities with descriptive components that are much stronger than their analytic components or that fall within the descriptive area of the descriptive-analytic spectrum.
When new health problems arise, health practitioners need to find details on the determinants. The most basic starting point is to collect detailed information about a single case (case-report) and search for additional persons with similar cases and gather information from a series of similar cases (case series). The most fundamental information focuses on three key aspects: Person, place, and time. These fundamental elements enable us to look for suggestive patterns.
- Person - all relevant characteristics including age, diet, behaviors, exposures, etc.
- Place - Spatial distribution of the problem.
- Time - Whether the frequency of disease varies over time.
- Differences - Factors may cause the frequency of disease to differ in circumstances
- Similarities - A high frequency of disease found in several different circumstances with a common factor
- Correlations - If the frequency of disease varies in relation to some factor
Epidemiological Studies
A study is a scientific process of answering a question using data from a population. The first step is having a question to study, then decide a study type, collect and analyze data (ethically), interpret results, and reporting findings.
Types of studies
Ecological Study
Disease rates and information about exposures are made on a group of people. Could be a household or an entire country. Results apply to groups and not individuals, meaning these studies are better at comparing health between populations and generating questions.
Case Series
Describes characteristics of people with the same disease or exposure.
Cross-Sectional/Prevalence Study
Health information of a selected population at a given point in time. Usually involves a questionnaire or survey and are relatively inexpensive, but it cannot determine if exposure caused a disease because the data is collected from a single point in time (i.e. which came first) and also tend to favor cases with a longer duration and overlook cases which recovered quickly.
Case Control Study
People with a disease, called cased, and people without the disease but with similar characteristics, called control, are asked about past exposures to certain risk factors. For each risk factor the odds of being exposed as a case is compared to the odds of being exposed if they were control, giving us the Odds Ratio (OR).
| Cases (Have Disease) |
Controls (No Disease) |
|
| Exposed |
a |
b |
| Unexposed |
c |
d |
Odds Ratio (OR) = (a/c) / (b/d) = a*d / b*c = Odds that a Case was Exposed / Odds that a Control was Exposed
Relative Risk (RR) = (a / (a + b)) / (c / (c + d)) = Risk of Disease of Exposed / Risk of Disease Unexposed
If the OR is greater than 1 than the risk factor is associated with disease, less than 1 suggests its a protective factor and =1 suggests no association.
This is often used when searching for food-borne illnesses. They are quick and cheap, and can be used for uncommon disease. It falls short when finding rare exposures, and it can be difficult to find a representative control selection who can accurately recall if they were exposed.
Cohort Study
A group of people are followed over a period of time to collect data on risk factors and then compare occurrences of similar outcomes of those who were exposed and those who were not.
The main measurement used in cohort studies is called the Relative Risk (RR), which is the risk of disease for those exposed to a risk factor over the risk of disease in the unexposed group.
RR > 1 is increased risk, RR < 1 is lower risk, RR = 1 is same risk
Advantages are that time sequence can be determine causality and info on various outcomes/risk factors can be collected at the same time. Disadvantages are the fact that many people have to be followed over a long period of time make them costly and not good for rare diseases, also if too many people drop out it will interfere with the results of the study.
Interventional Study
Intervention is done on a group and outcomes are measured. This could be medicine, vaccine, health advise, etc.
The best design for an interventional study is a randomized controlled trial, where people are randomly selected from the population to either receive the intervention or take part in the control group. Ideally the experiment would be double blind, where neither the participant or investigator know who is the control group.
These studies can provide good evidence of causality, and randomization provides equal chance that groups are similar. Disadvantages are the cost of finding participants.
Summaries
Summaries are studies made with other studies. Systematic review finds all relevant studies to a topic, assesses and interprets the results and creates an unbiased, impartial summary of the evidence. A meta-analysis uses data from studies which asked the same question and had a similar design, then uses that data to combine analysis and produce a single summary result.
Examples of Descriptive Epidemiology
Case Report
A detailed description of disease occurrence in a single person.
Ex. April 1983, it was not yet know AIDS could be transmitted by blood. An infant born with a blood disorder required transfusion from 18 donors over 8 weeks and later developed a low T cell count suggesting AIDS. It was later found one of the donors died of AIDS.
Case Series
A report on the characteristics of a group of subjects who all have a particular disease or condition. Cannot be used to infer causality because there is no comparison group, but can be used to hypothesize questions for a study.
Ex. 1981 Pneumonia study on previously healthy young men, which was an important milestone in the AIDS epidemic. Case studies cannot establish a valid association but in this case laid the groundwork for subsequent case-control and cohort studies.
Cross Sectional Surveys
Surveys which assess the prevalence of disease and risk factors at the same point in time.
Ex. US government agencies sent surveys to random samples of the US population asking about health status and behaviors. There was a heart disease survey given to farmers asking only if they were physically activity. Because the participants were not followed, we can't tell if the cases developed heart disease because they were inactive, or if they are inactive because they developed heart disease.
However, in some circumstances the temporal relationship is clear. Ex. a study which measures salary between male and female employees could be regarded as analytical because gender was already established because the outcome (salary). In a sense, cross sectional and ecological studies are an intermediate category between descriptive and analytic studies.
Ecological Studies
These studies are distinguished by the fact the unit of observation is not a person but an entire population.
Ex. Comparing the rate of colon cancer based on meat consumption in different countries. The issue is the study assumes everyone in each country has the same exposure, or ate the same amount of meat. There is no information about individual people, thus there is no way of knowing if the people who ate the most meat are the ones who developed colon cancer. This is referred to as ecological bias or ecological fallacy.
Analytical Studies
Descriptive epidemiology is useful for generating hypotheses about determinants of health, but they have a number of limitations that do not allow them to firmly establish a valid association between a given factor and a health outcome.Analytic studies are more formal comparisons that enable investigators to test specific hypotheses. Samples of subjects are identified and information about exposure status and outcome is collected and analyzed in order to estimate the magnitude of association.
Prospective Cohort Studies
A cohort is an identified individual who does not have the outcome of interest initially, but have potential to develop the outcome of interest.
Ex. Framingham Heart Study enrolled residents who did not have cardiovascular disease when enrolled and followed them to see if and when they developed cardiovascular issues.
Retrospective Cohort Studies
In contrast to prospective cohort studies, retrospective cohort studies are conceived after some subjects have already developed the outcome of interest. Investigators jump back in time to identify a cohort of individuals at a point in time before they developed an outcome and try to establish exposure.
Ex. studying employee health records at a chemical plant after multiple employees die. The preexisting data was data may not be acquired in a predetermined way or may be incomplete.
Intervention Studies
Experimental research studies that compare the effectiveness of public health interventions or medical treatments. The design is similar to prospective cohort studies, except that the exposure is assigned by investigators. Exposure status is assigned randomly to produce equal effects of confounding variables.
Ex. A drug treatment trial with a placebo group.
Case Control Studies
Cohort studies fall short when the outcome being investigated is rare, or there is a long period of time between exposure and outcome. In a case control study, investigators start by finding an adequate number of cases who already have the outcome and a comparison group without the outcome and all are sorted into an exposed or unexposed categories.
Rare Disease in Plymouth County
In this hypothetical situation Plymouth County has a total population of 6647.
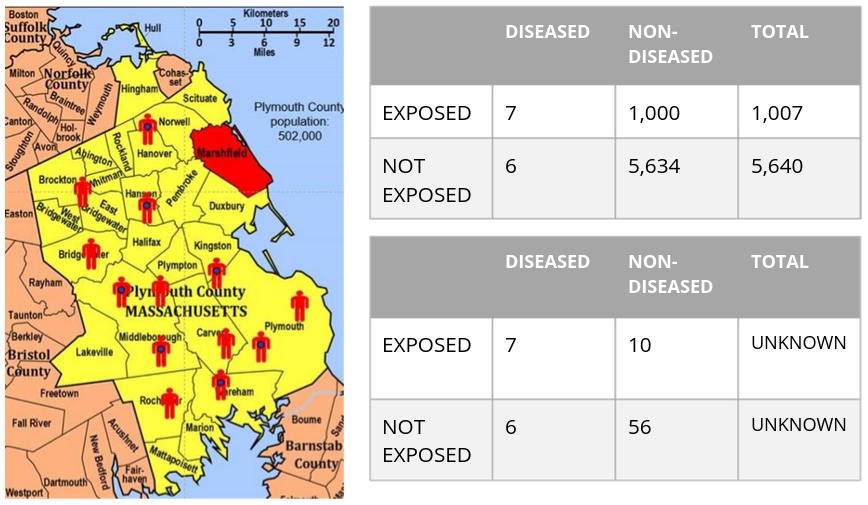
If we somehow had all the exposure and outcome information in the source population we could calculate the incidence of exposed and non-exposed individuals and calculate the risk ratio.
Ie = 7 / (1000 + 7) = .70%
Iu = 6 / (6 + 5634) = .11%
RR = .7 / .11 = 6.5
Meaning those exposure to the risk factor had 6.5 times the risk of getting the disease.
However, in practice we rarely have the resources to get data on all subjects in a population. In the lower table we take a sample of 1% of the non-diseased population. We can't predict the Risk Ratio because we don't know the denominator, but we can compute the odds of disease in each group
Oe = 7:10
Ou = 6:56
Odds Ratio = (7/10) / (6/56) = 6.65
This is very close to the risk ratio and thus is a reasonable estimate.
Which Study is best?
- If the outcome is uncommon a case control study would be best
- If the exposure is uncommon a cohort study is best
- Consider ethics: if studying the association between smoking and cancer it wouldn't be ethical to conduct a clinical trial in which you randomly assign half the subject to smoking
- Resources: If you have limited time, money and personnel to gather data it is unlikely that you will can conduct a prospective cohort study. A case-control study or retrospective cohort study would be better options, depending on if the outcome or exposure was more rare
Sources of Error
Random error (Sampling Error) - Samples may provide estimates of relationships in the population that are inaccurate, particularly if the population size is small
Bias - Estimates of parameters in the population may be distorted by errors in the data collection (information bias) and if the selection or retention of subjects into our samples is somehow dependent on the exposure-outcome relationship (selection bias)
Confounding - a particular type of bias that occurs when other determinants of the outcome are unevenly distributed in the groups being compared
Program Evaluations
To know if programs and interventions are effective one needs to answer several critical questions:
1. Is the program meeting its objectives? Why or why not?
2. What are the strengths of the program?
3. How might the program be improved?
4. What can be learned from current or past programs to improve future programs?
Types of Program Evaluation
Formative
The goal is to obtain feedback on strengths and areas of improvement for the program and explore overall applicability and feasibility of the project. Typically takes place early in the inception to determine whether the program is applicable or makes sense.
Ex. Focus groups at a community center, pen and paper surveys, one-on-one interviews with members of the target community
Process
Addresses whether the program was implemented as intended and why it did or did not meet its main objectives.
Ex. Access what percent of a online education model was completed, interview program coordinators
Outcome/Impact
Measure the overall effectiveness of the program in meeting its objective.
Ex. Observing teen pregnancy rates 5 years after a sex education course.
Framework for Program Evaluation
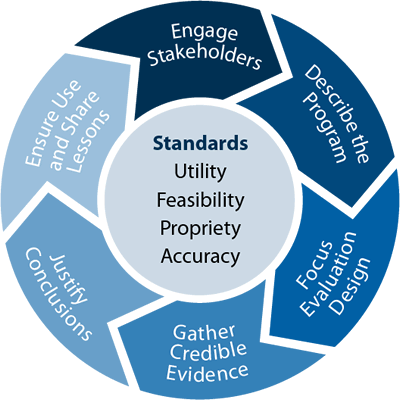
Engage Stakeholders
An accurate, valid evaluation is a major goal for evaluators, but ultimately the strongest evaluation is the one used to beget action. In order to do so, a critical step is to consider the evaluation audience (stakeholders) and who is most invested.
Describe the Program
Elucidate and explore the program's theory of cause and effect, outline and agree upon program objectives, and create focused and measurable evaluation questions.
Focus Evaluation Design
Consider your hypothesis and available resources and weigh different design options to understand advantages and limitations of design options.
Gather Credible Evidence
Data collection is essential to support evaluation conclusions and recommendations. What you collect and how directly impacts the quality and credibility of findings.
Justify Conclusions
Use the evidence and data analysis to answer the main research questions and create conclusions and recommendations.
Use and Share Lesson Learned
The primary goal of an evaluation should be useful and this requires communicating and sharing results. Stakeholders should be aware of the study process, findings, and efforts should be made to ensure results are incorporated into program decisions.
No Comments