Frequently Used Visualizations
Now that I've covered the basics of programming in D3, let's take a look at some of the other cool things one can build with D3. Before jumping into the code, it's worth mentioning the resources available within the D3 community for sharing reusable code. As of writing this there are sites like VisHub or the D3 Graph Gallery which contain some commonly used D3 code snippets.
Also, this guide mostly follows version 7 as it is the latest . Sometimes libraries are slow to update documentation examples so it is important to read the change log when trying to upgrade D3.
Layouts
Layout functions format the data to include attributes that allow for drawing the data.
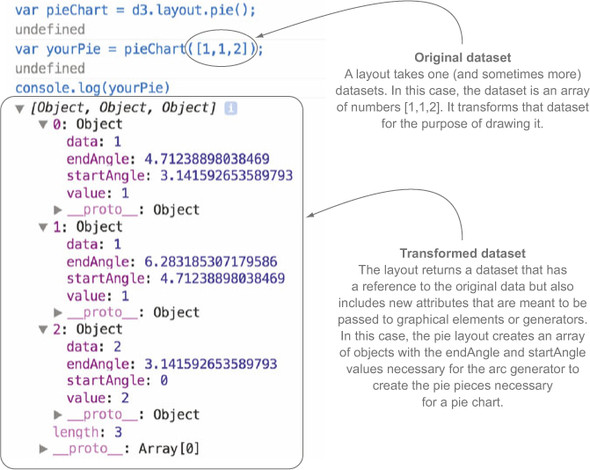
I found the below visualizations here and here, but note it uses D3 v3 syntax, for v4+ we would just use d3.pie() rather than d3.layout.pie()
Other layouts include:
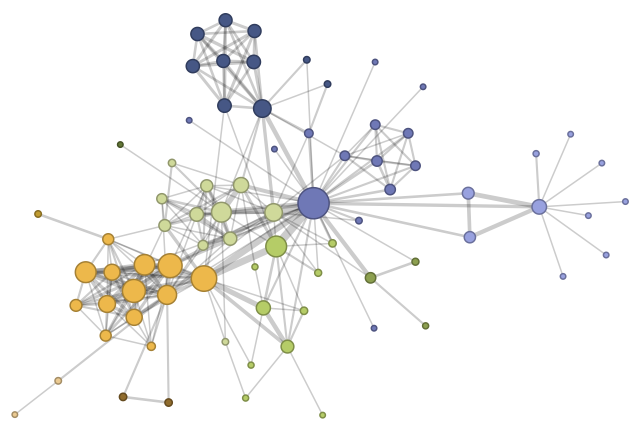
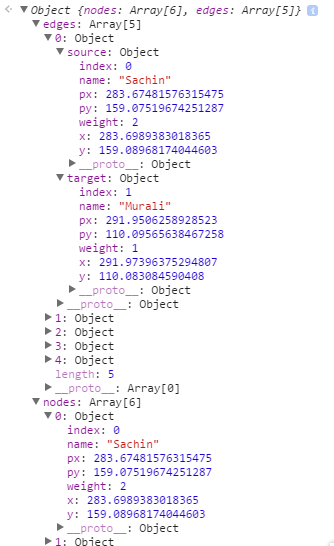
- d3.force() - Nodes are represented as circles and edges (connections) as lines


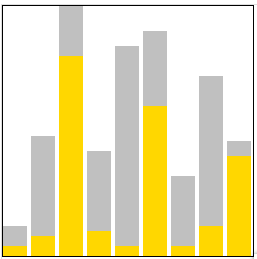
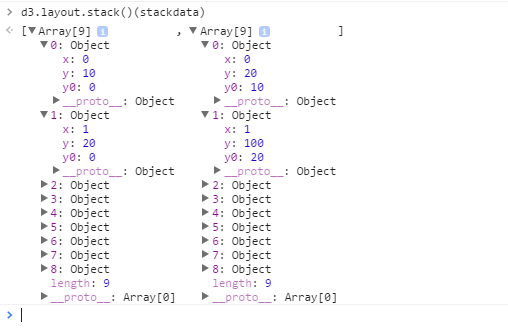
- d3.stack() - Good for illustrating how ratios compare over time


Choosing the Right Data Structure
There are cases where the above functions expect data in a certain format, that being either an Array or Object (map).
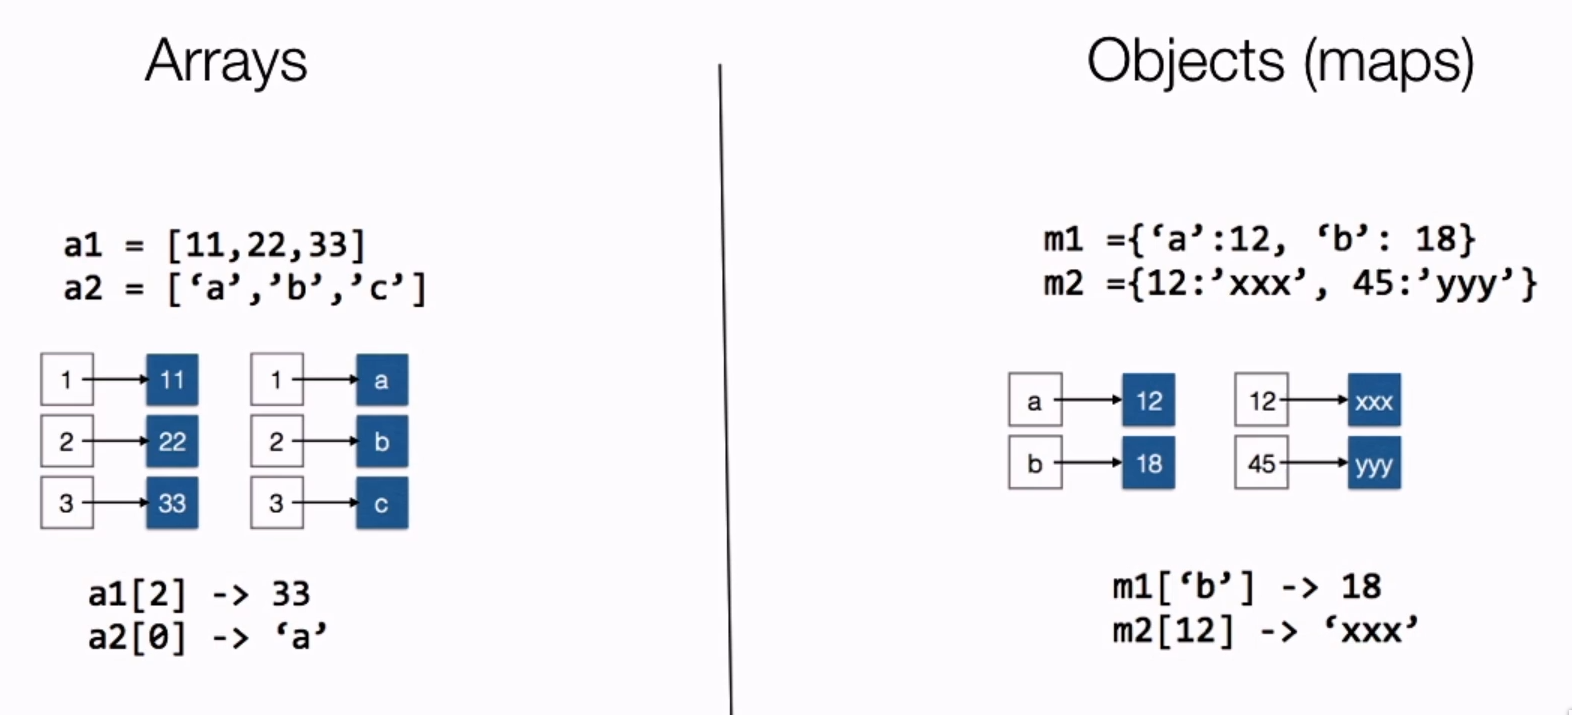
The advantage with Maps is we can find a key without the index or searching the entire data structure. In D3 we often work with Arrays of objects, which can make searching for a field within an object cumbersome. The D3 group(), or groups() function (previously known as nest()) can create a map of JS objects based on a category.