Introduction to D3.js
Setting Up
The <script> tag used to download the latest release can be found on the D3 Homepage
WebStorm from Jetbrains is my personal choice for JS development. Visual Studio Code from Microsoft is also very popular.
ItIf not included in your IDE, it is also helpful to have a simple HTTP Server to run html. Python has a built-in http server, so if you have python it's an easy option with no additional packages needed. In the terminal go the directory where the files you want to host are and run:
python -m http.server 9000
npm also has an http server that reloads changes automatically, but it needs to be installed:
npm install -g http-server
Then it can be run with http-server
Understanding the Scaleable Vector Graphics
SVGs allow us to draw shapes with code on a coordinate grid. The markup code is very similar to HTML, and file sizes are small.
You can create an SVG in HTML with the <svg> tag and define the demensions of the canvas. By default the Top Left of the canvas is (0,0) and Botton Right is (x, y) where x is max width and y is max height. This can be changed with the "text-anchor" attribute. Below are some examples embedded in HTML but when working in D3 this would be normally implmented within Javascript:HTML:
<svg width="400" height="60">
	<!-- "x" and "y" coordinates give a shape its position (top left hand corner) -->
	<rect x="0" y="0" width="50" height="50" fill="green"></rect>
	<!-- For circles, choose the center with "cx" and "cy", and the radius with "r" -->
	<circle cx="90" cy="25" r="25" fill="red"></circle>
	<!-- Ellipses are similar, but they take "ry" and "rx" attributes -->
	<ellipse cx="145" cy="25" rx="15" ry="25" fill="grey"></ellipse>
	<!-- Lines need two pairs of coordinates and a stroke width -->
	<line x1="185" y1="5" x2="230" y2="40" stroke="blue" stroke-width="5"></line>
	<!-- Text takes an x/y coordinate and a font size -->
	<text x="260" y="25" font-size="20px" fill="orange">Hello World</text>
</svg>
<div>
	<svg width="190" height="160" xmlns="http://www.w3.org/2000/svg">
		<path d="M10 80 C 40 10, 65 10, 95 80 S 150 150, 180 80" stroke="black" fill="transparent"/>
	</svg>
</div>
When working in D3 this would be normally implmented within Javascript, as large projects would become very hard to read if we embedded everything in HTML.
D3 Basics
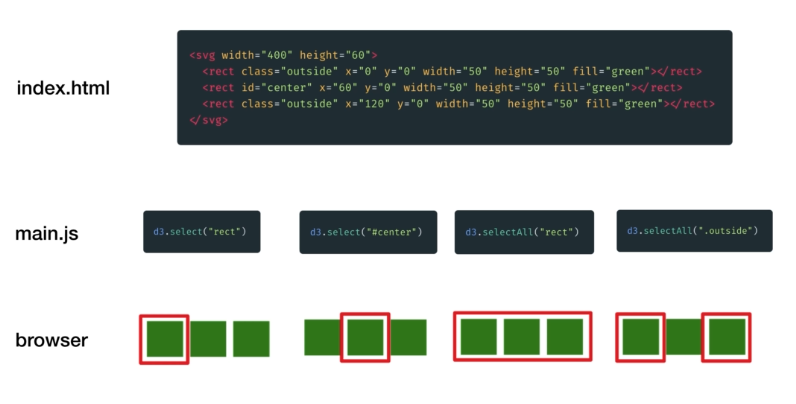
D3 Select Uses CSS Selectors to return page elements similar to JQuery, then we can use D3 commands such as binding data to shapes. Below demonstrates how selecting works:
// 1. Select the SVG image
const svg = d3.select("#canvas")
// 2. Append Something to it
const rect = svg.append("rect")
// 3. Set Attributes
rect.attr("x", 25)
rect.attr("y",0)
rect.attr("width", 150)
rect.attr("height", 150)
rect.attr("fill", "blue")
It is cleaner to use method chaining:
const svg = d3.select("#canvas")
  .append("rect")
    .attr("x", 25)
    .attr("y",0)
    .attr("width", 150)
    .attr("height", 150)
    .attr("fill", "blue")