Module 13: Linear Regression
Correlation and regression attempt to describe the strength and direction of the association between two (or more) continuous variables.
Pearson Correlation
Recall r is an estimate of population correlation coefficient:
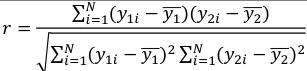
It is always between -1 and 1. With 0 indicating no positive or negative linear relationship between the variables. A strong correlation does not imply causality.
It indicates the strength and direction of a linear relationship between two random variables. The square of r, r2 = R, measures how much information is shared between two variables; It is also called the coefficient of determination.
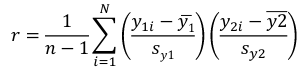
r can also be expressed as the average product in standard units in terms of sample standard deviations:
Assumptions for Pearson's Correlation:
- Observations are independent
- The association is linear
- Variables are approximately normally distributed
We can compute a test statistic for r with a t-distribution:
t = r / se(r); Where SE of r = sqrt((1-r^2)/(n-2))
Note that se is inversely related to n, so a large sample size results in a smaller se(r). Also the test has n-2 degrees of freedom.