Sampling
Types of probability samples:
- Simple random sample - everyone in the population has equal likelihood of being selected
- The most effective, but often hardest to execute
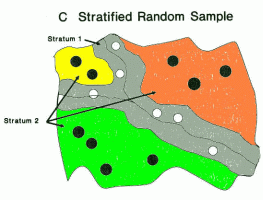
- Stratified random sample - we create strata based on some factor and take a random sample from each strata
- Protects against bad sampling
- Decreases variance - increases precision in subgroups
- Decreases cost sometimes
- We can choose a proportion of each group, or base the proportion on the proportion of the subgroup in the population

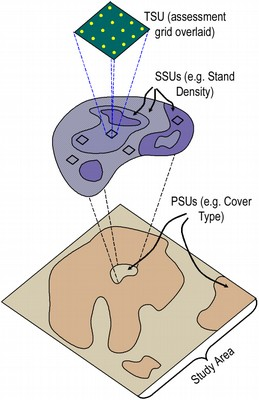
- Cluster sample - Group observations based on how they are collected, randomly choose several groups then random sample in each cluster
- Easier and decreases cost compared to SRS
- Cluster is also called primary sampling unit (psu)
- We can also have secondary sampling units if we cluster again within the psu
- Individually sampled units are not necessarily independent (clusters are likely to have similar characteristics

- Systematic / Multistage sample - a study design that incorporates multiple sampling strategies

Complex designs can be necessary to extract valid or more precise information from a sample we want to represent a target population.
In a simple random sample each individual has equal chance of being selected, but in clustering we need to weight samples if the clusters are different sizes.
Missing Data
Missing Completely at Random (MCAR)
The probability an individual value will be missing does not depend on the outcome, any collected variables, variables not collected or the survey design
Missing at Random (MAR)
The probability an individual value is missing is independent of the outcome of interest and unobserved variables, but depends on the covariates in the model. In other words the response rate only depends on observed data.
Non-ignorable missing data
The probability an individual value is missing depends on unobserved variables and cannot be completely explained by variables that have been collected
What to do?
- Ignore it
- Worst approach as it reduces sample size and power
- Prevent it
- Try to design the survey to minimize non-response
- Statistical methods
- Imputation - Estimating missing values from information from other observations
- Divide data into homogenous strata and determine the variables to impute
- Imputation - Estimating missing values from information from other observations
No Comments