Making Graphs
Scales
Scales are functions that map from an input domain to an output range
Linear Scales
Linear scales have equal division for equal values. We input a svg to grid and scale it down to fit the demensions so it doesn't run off the screen. Consider the following:
const y = d3.scaleLinear()
	.domain([0, 828])
    	.range([0, 400])

console.log(y(100)) // 48.3
console.log(y(828)) // 400
console.log(y(414)) // 200

console.log(y.invert(48.3)) // 100
console.log(y.invert(400)) // 414
console.log(y.invert(200)) // 428
One of the most common types of linear scales is a time scale. The input is a JS Date Object and the output is a number. Keep in mind months are indexed starting at 0.
const x = d3.scaleTime()
	.domain([
    		new Date(2000,0,1),
            	new Date(2001, 0, 1)
            ])
            .range([0, 400])


console.log(x(new Date(2000, 7, 1)) // 199

console.log(x.invert(199)) // Tue Aug 01 2000
Logaritmic Scales for Diverging Data
Often data sets that grow over time will grow exponentially, such as population. In these cases we would need to use a log scale.
Performing a log scale on a dataset will change the difference between points in a data set to be even (linear).
Remember: You cannot take the log of 0. So never use log on a dataset where the domain passes through 0.
Consider the following:
const y = d3.scaleLog()
	.domain([300, 1500000])
    	.range([0, 400])
        .base(10)

console.log(y(500)) // 32.9
console.log(y(5000)) // 181.1
console.log(y(50000)) // 329.3

console.log(y.invert(32.9)) // 500
console.log(y.invert(181.1)) // 5000
console.log(y.invert(329.3)) // 50000
Ordinal Scales
For assigning color schemes to categorical data. If there are more items in the domain than the range then the array loops back around from the start. There are also pre-build color schemes.
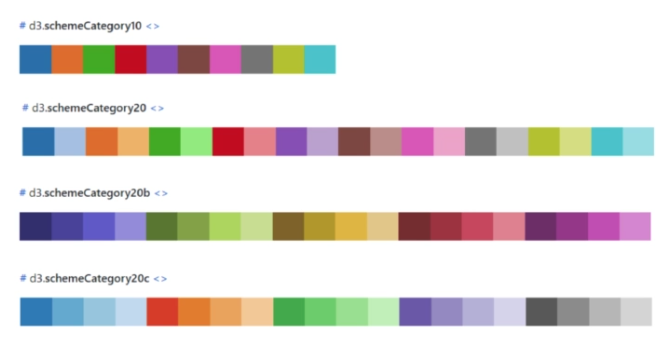
const color = d3.scaleOrdinal()
	.domain([
    	"AFRICA", "ASIA"
    ])

    .range([
    	"RED", "BLUE", "GREEN"
    ])
    // Alternatively
    //.range(d3.schemeCategory10)


console.log("AFRICA") // "RED"
console.log("ASIA") // "BLUE"
console.log("EUROPE") // "GREEN"
console.log("PANGEA") // "RED"
It is not possible to take the invert of a ordinal scale.
Band Scales
Discrete Domain, Continous Range
Band scale are almost exlusively used to space out different categories in a bar chart. The scale splits up the range into bands of equal length based on the number of elements in the array.
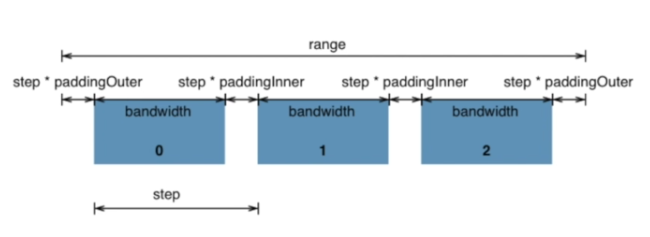
We give the scale an array of categories as a domain and a min and max values for the range. Also a ratio between 0 and 1 for the inner and outer padding needs to be provided, which defines how thick the bars should be. A padding ratio of 0 means no spacing between bars.
If we call a value that doesn't exist in the domain the scale returns undefined.
const x = d3.scaleBand()
	.domain([
    	"AFRICA", "N. AMERICA",
        "EUROPE", "S. AMERICA",
        "ASIA", "AUSTRALIA"
	 ])
     .range([0, 400])
     .paddingInner(0.3)
     .paddingOuter(0.2)

console.log(x("S. AMERICA")) // 209
console.log(x("AUSTRALASIA")) // 341
console.log(x("AFRICA")) // 13.1

console.log(x.bandwidth()) // 45.9
Determine Min and Max
Rather than defining range and domain as static values, D3 has a few functions to determine these automatically; min, max and extent. They all work generally the same, they take an array of data and an access function as arguments. The accessor function loops over every item in an array.
const data = [
	{ grade: "A", value: 4 },
    { grade: "C" , value: 1}
]

const min = d3.min(data, d => d.value) // 1
const max = d3.max(data, d => d.value) // 4
const extent = d3.extent(data, d => d.value) // [1, 4]
const grades = data.map(d => d.grade) // ["A", "C"]