Public Health Surveillance
BS728: A Methods Based Approach to Public Health Surveillance
Surveillance Defined
Surveillance is the ongoing systematic collection, analysis and interpretation of outcome-specific data for use in the planning, implementation and evaluation of public health practice. Surveillance can have a negative connotation, but we can use it to:
- Identify patients and their contacts for treatment and intervention
- Detect epidemics, health problems, changes in health behavior
- Estimate magnitude and scope of health problems
- Measure changes in infectious and environmental agents
- Assess effectiveness of programs
- Develop hypotheses and stimulate research
Modes of Surveillance
Active Surveillance
- Health agencies reach out to health care providers
- More complete reporting
- Active case finding
Passive Surveillance
- Diseases are reported by health care providers
- Simple and inexpensive
- Incomplete and variable data quality
Sentinel Surveillance
- Reporting of health events by health professionals who are selected to represent a geographic area or specific reporting group
- Can be active or passive
Syndromic Surveillance
- Focuses on one or more symptoms rather than a physician-diagnosed or laboratory-confirmed disease
Surveillance Systems Attributes
- Usefulness - Does this system accomplish its objectives?
- Data quality - How reliable is the available data? How complete is it?
- Timelines - How quickly is information received?
- Simplicity - How easy is the system?
Data Sources and Reportable Disease
Electronic health records, birth and death registries and surveys are all examples of data sources for public health data. The CDC publishes a summary of reportable disease activity each week in the MMWR.
In MA, disease are reported through an electronic system called MAVEN.
After a drug is approved, passive surveillance is performed to detect adverse events. Health professionals or consumers can report suspected adverse events through MedWatch on the FDA site.
National Center for Health Statistics (NCHS) administers national health surveys and oversees vital statistics and archive of national data.
Demographic and Health Surveys (DHS) are a tool which can be used in resource poor settings and performed regularly.
Emerging Infection Program (EIP) was established in 1995 by the CDC. It is a network of 10 state health departments and their collaborators. Some of their work includes Active Bacterial Core Surveillance (ABCs), FoodNet, and impact of infectious diseases.
Public Health Action
- Describe the burden of or potential for disease
- Monitor trends and patterns in disease, risk factors, and agents
- Detect sudden changes in disease occurrence and distribution
- Provide data for programs policies and priorities
- Evaluate prevention and control efforts
Sampling
Terminology
Observation Unit: Object on which measurement is taken
Sampling Unit: A unit that can be selected for a sample
Target Population: The completely group we want to study and make statements about
Census: Survey designed to sample the entire population
Sample: Finite sample of target population
Sampling Frame: List, map, etc. that shows all units from which a sample can come
Parameter/Statistic: Any numerical value that describes a population
Estimator: Any statistic that approximates a parameter
Variance: How precise is the estimator? What are sources of uncertainty
Bias: How close is the statistic to the parameter
Sources of Bias
Convenience sample: Select units that are the easiest to get
Judgment sample: Purposely selecting a "representative" sample
Misspecify the target population
Undercoverage: Fail to include all the target populations
Overcoverage: Include population units in the sampling frame that are not included in the target population
Nonresponse: Failing to get responses from all who were chosen to be in the sample
Sample consists entirely of volunteers
Measurement error: Sensitive questions people will lie on, recall bias when people forget, question wording or order
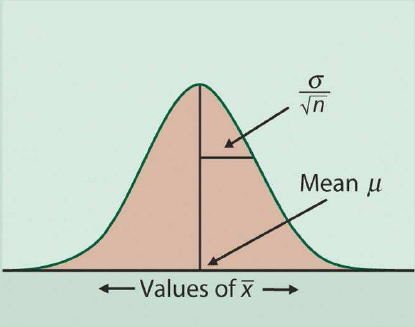
Central Limit Theorem
A very important idea in sampling is when we select a large, random sample measuring an estimator it will eventually meet the true population value, and we can use a normal distribution. It also tells us how "wide" the histogram is, or how much our sample mean could vary from the true mean.
Sampling
Types of probability samples:
- Simple random sample - everyone in the population has equal likelihood of being selected
- The most effective, but often hardest to execute
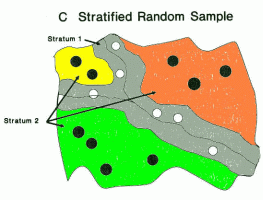
- Stratified random sample - we create strata based on some factor and take a random sample from each strata
- Protects against bad sampling
- Decreases variance - increases precision in subgroups
- Decreases cost sometimes
- We can choose a proportion of each group, or base the proportion on the proportion of the subgroup in the population

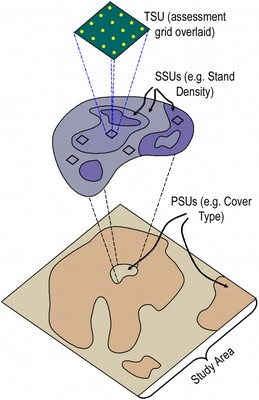
- Cluster sample - Group observations based on how they are collected, randomly choose several groups then random sample in each cluster
- Easier and decreases cost compared to SRS
- Cluster is also called primary sampling unit (psu)
- We can also have secondary sampling units if we cluster again within the psu
- Individually sampled units are not necessarily independent (clusters are likely to have similar characteristics

- Systematic / Multistage sample - a study design that incorporates multiple sampling strategies

Complex designs can be necessary to extract valid or more precise information from a sample we want to represent a target population.
In a simple random sample each individual has equal chance of being selected, but in clustering we need to weight samples if the clusters are different sizes.
Missing Data
Missing Completely at Random (MCAR)
The probability an individual value will be missing does not depend on the outcome, any collected variables, variables not collected or the survey design
Missing at Random (MAR)
The probability an individual value is missing is independent of the outcome of interest and unobserved variables, but depends on the covariates in the model. In other words the response rate only depends on observed data.
Non-ignorable missing data
The probability an individual value is missing depends on unobserved variables and cannot be completely explained by variables that have been collected
What to do?
- Ignore it
- Worst approach as it reduces sample size and power
- Prevent it
- Try to design the survey to minimize non-response
- Statistical methods
- Imputation - Estimating missing values from information from other observations
- Divide data into homogenous strata and determine the variables to impute
- Imputation - Estimating missing values from information from other observations
Sampling Strategy
We could determine if a intervention is meeting the target through a census, sampling plan ,or LQAS.
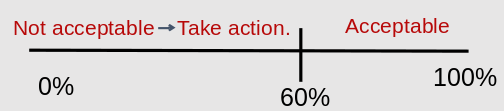
LQAS
- LQAS is a primary classification tool
- Lots are classified as performing "acceptable, unacceptable, low or high"
- The goal is to shift resources with unacceptable coverage and study best practice with acceptable coverage
- Classification is based on the sample from the population
- We just need 19 households to sample, a much smaller sample than most population estimates
- To classify as high or low we need to define a target, or decision threshold
- We to choose a threshold that makes the chance of a mistake very small
- We want at least 1 - alpha chance to be in the upper category based on probability for being in the upper (chance of is type 1 error is alpha)
As always increasing sample size decreases error. Also we can decrease the size of alpha.
LQAS classifies whether something is likely to meet the threshold or not. It does not measure prevalence or probability.
Time Series
A times series is a set of data point collected over time,. These might be measurements of a daily process and are quite common in surveillance. Statistical models for time series is indexed by time (X or y) and may or may not be independent or identically distributed.
Collection tools and methods
- Regression methods for modeling trends
- Fourier/wavelet analysis for modeling seasonality
- ARIMA modeling for correlation
When modeling a time series we can choose to use a retrospective or prospective approach to analysis. This allows use to use times series for event detection, interpretation of past results, forecasting or decision making.
General Approach
- Plot the series and examine the main features
- Trend
- Seasonal component
- Any apparent changes in behavior
- Any outlying observations
- Model trend and seasonal components to get stationary residuals
- Regression methods are useful for this
- Choose a model to fit the residuals
- In some settings, forecasting can be performed by forecasting the residuals and then adding on predicted trend and seasonal component
Once we have a time series model we can apply it to a retrospective or prospective application.