# Model Fitting: Inference
Given several predictors and a response, we need to figure out whether all are needed.
Consider a large model, Ω, and a smaller model, 𝜔, which consist of a subset of predictors in Ω.
- If there is not much difference in fit, we perfer the smaller model.
- If the larger model has a much better fit, we perfer the larger model
Suppose we have a response Y and a vector pI regressors XI = (X1, X2) that we partition into two parts so that:
- X2 has q regressors
- X1 has the remaining pI - q
The general hypothesis test we consider is:
[](https://bookstack.mitchellhenschel.com/uploads/images/gallery/2022-09/image-1663885960711.png)
The null hypothesis is obtained by setting beta\_2 = 0
The reasoning is that if RSS𝜔 - RSSΩ is small, the fit of the smaller model is almost as good as the larger model. On the other hand, if the difference is large the superior fit of the larger model would be perferred.
This suggests (RSS𝜔 - RSSΩ)/RSSΩ would be a potentially good test statistic where the denominator is used for scaling purpose
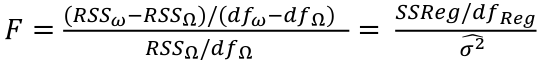
### F Tests
Suppose the dimensions of Ω is p and that of 𝜔 is q. The general formula for the test is:
[](https://bookstack.mitchellhenschel.com/uploads/images/gallery/2022-09/image-1663886557966.png)
where dfΩ = n - p, and df𝜔 = n - q
Thus, we would reject the null hypothesis if F > Fα p - q, n - p
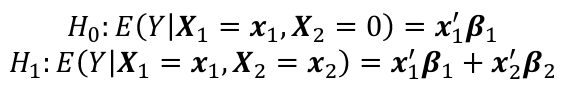
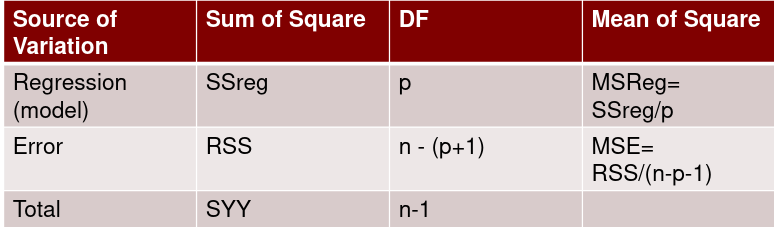
#### Simple Regression
[](https://bookstack.mitchellhenschel.com/uploads/images/gallery/2022-09/image-1663887396158.png)
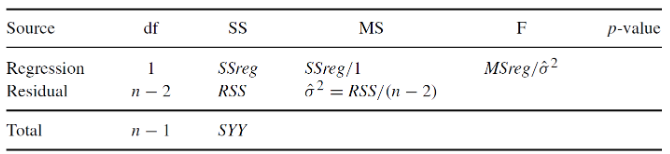
Recall the ANOVA table for a simple regression:
[](https://bookstack.mitchellhenschel.com/uploads/images/gallery/2022-09/image-1663887176176.png)
Under the null hypothesis:
[](https://bookstack.mitchellhenschel.com/uploads/images/gallery/2022-09/image-1663887330435.png)
The df is the number of n observations minus the number of estimated parameters: (n-1)
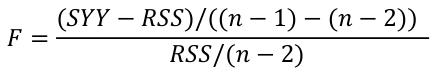
Under the alternative hypothesis:
[](https://bookstack.mitchellhenschel.com/uploads/images/gallery/2022-09/image-1663887289267.png)
### Test of All the Predictors
[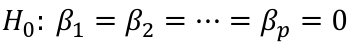](https://bookstack.mitchellhenschel.com/uploads/images/gallery/2022-09/image-1663887421754.png)
[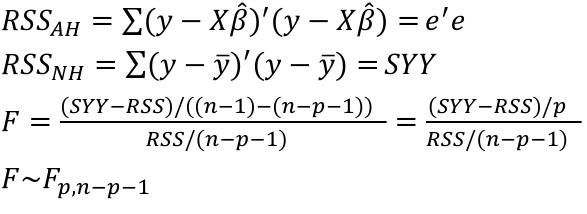](https://bookstack.mitchellhenschel.com/uploads/images/gallery/2022-09/image-1663887440224.png)
Where p is the number of regressors and n is the sample size.
[](https://bookstack.mitchellhenschel.com/uploads/images/gallery/2022-09/image-1663887487824.png)
#### One Predictor
Can a particular predictor be dropped from the model?
[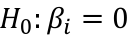](https://bookstack.mitchellhenschel.com/uploads/images/gallery/2022-09/image-1663887532157.png)
A t test can be used with (n - p - 1) degrees of freedom
[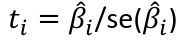](https://bookstack.mitchellhenschel.com/uploads/images/gallery/2022-09/image-1663887559097.png)
The F test may be used as introduced earlier with a df of 1, n-p-1. ti2 here is exactly the F-statistic.