D3.js
Fundamentals of D3, a data visualization library for creating dynamic, interactive charts, plots, and maps.
- Data Driven Documents
- Making Graphs
- The Basics of Design
- Dynamic and Interactive Content
- Layouts and Structured Data
- File Structure and Linked Views
Data Driven Documents
Introduction
D3 is a JS library which can be used to create charts and visualiztions, but to call it a "charting" library is an understatement. It provides tools for manipulating SVG/HTML and manipulating data. It's 'low-level' nature allows users to customize and create complex visualizations with dynamic and interactive content. However, this also gives it a steep learning curve. I would encourage readers to consider the complexity of the task they are trying to achive and whether it would be more practical to use chart.js or plotly.
Credit to the following for helping me build this tutorial:
- Mastering data Visualization in D3.js - I followed this udemy course, worth $10
- D3 in Action - Probably the best textbook on D3 out there. They have an old edition for free on their website, it uses an older version of D3 but the fundementals are the same
- D3InDepth - Great tutorials with D3 v6 and 7
- D3 Getting Started Guide - The official documentation, I don't love the order it presents information
- D3 Graph Gallery - D3 templates and example code
Find the full code examples in this course on my github.
Setting Up
The <script> tag used to download the latest release can be found on the D3 Homepage
WebStorm from Jetbrains is my personal choice for JS development as it contains an http-server for viewing changes instantly. Visual Studio Code from Microsoft is also very popular.
If not included in your IDE, it is also helpful to have a simple HTTP Server to run html. Python has a built-in http server, so if you have python it's an easy option with no additional packages needed. In the terminal go the directory where the files you want to host are and run:
python -m http.server 9000
Alternatively, npm also has an http server that reloads changes automatically, but it needs to be installed:
npm install -g http-server
Then it can be run with http-server
Understanding the Scaleable Vector Graphics
SVGs allow us to draw shapes with code on a coordinate grid. The markup code is very similar to HTML, and file sizes are small.
You can create an SVG in HTML with the <svg> tag and define the demensions of the canvas. By default the Top Left of the canvas is (0,0) and Botton Right is (x, y) where x is max width and y is max height. This can be changed with the "text-anchor" attribute. Below are some examples embedded in HTML:
<svg width="400" height="60">
	<!-- "x" and "y" coordinates give a shape its position (top left hand corner) -->
	<rect x="0" y="0" width="50" height="50" fill="green"></rect>
	<!-- For circles, choose the center with "cx" and "cy", and the radius with "r" -->
	<circle cx="90" cy="25" r="25" fill="red"></circle>
	<!-- Ellipses are similar, but they take "ry" and "rx" attributes -->
	<ellipse cx="145" cy="25" rx="15" ry="25" fill="grey"></ellipse>
	<!-- Lines need two pairs of coordinates and a stroke width -->
	<line x1="185" y1="5" x2="230" y2="40" stroke="blue" stroke-width="5"></line>
	<!-- Text takes an x/y coordinate and a font size -->
	<text x="260" y="25" font-size="20px" fill="orange">Hello World</text>
</svg>
<div>
	<svg width="190" height="160" xmlns="http://www.w3.org/2000/svg">
		<path d="M10 80 C 40 10, 65 10, 95 80 S 150 150, 180 80" stroke="black" fill="transparent"/>
	</svg>
</div>
When working in D3 this would be normally implmented within Javascript, as large projects would become very hard to read if we embedded everything in HTML.
D3 Basics
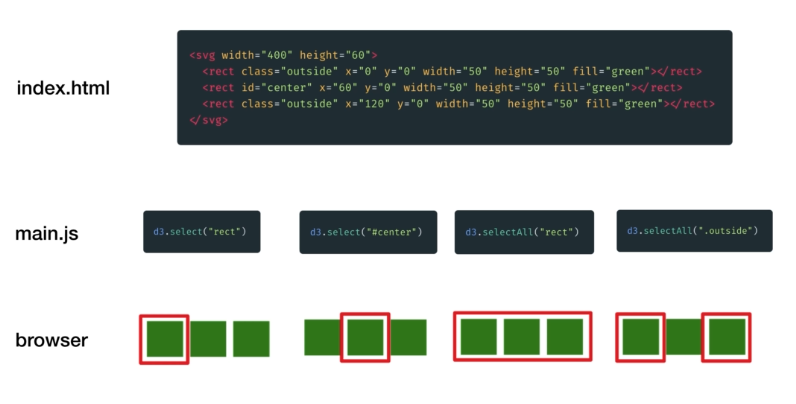
D3 Select Uses CSS Selectors to return page elements similar to JQuery, then we can use D3 commands such as binding data to shapes. Below demonstrates how selecting works:
// 1. Select the SVG image
const svg = d3.select("#canvas")
// 2. Append Something to it
const rect = svg.append("rect")
// 3. Set Attributes
rect.attr("x", 25)
rect.attr("y",0)
rect.attr("width", 150)
rect.attr("height", 150)
rect.attr("fill", "blue")
It is cleaner to use method chaining:
const svg = d3.select("#canvas")
  .append("rect")
    .attr("x", 25)
    .attr("y",0)
    .attr("width", 150)
    .attr("height", 150)
    .attr("fill", "blue")
Binding Data to Shapes
I'll go into more detail about data binding later, but for now recognize the enter() function binds data to a selected SVG. We can set attributes to be functions of the data:
const svg = d3.select("#chart-area").append("svg")
    .attr("width", 400)
    .attr("height", 400

const data = [25, 20, 15, 10, 5]

const circles = svg.selectAll("circle")
    .data(data)

// Create circle of various sizes and space them out evenly
circles.enter().append("circle")
    .attr("cx", (d, i) => {
        console.log("Item: " + d, "Index: " + i)
        return (i * 50) + 50
    })
    .attr("cy", 250)
    .attr("r", (d) => d)
    .attr("fill", "red")
Loading External Data
Data usaully comes in one of 3 formats:
- Comma Seperated Values (CSV)
name, age
Tony, 10
Mitch, 26
- Tab Seperated Values (TSV)
name	age
Tony	10
Mitch	26
- JavaScript Object Notation (JSON)
{
	{
    	"name": "Tony",
        "age": "10"
    },
    {
    	"name": "Mitch",
        "age": "26"
    }
}
All of these are loaded similarly and are always converted into JSON format:
d3.csv("data/ages.csv").then(data => {
	console.log(data)
	// Code goes here
})
Replace csv with the data format, you can use a relative or absolute path. The function returns a promise so we can pass the value around the code without waiting for it to evaluate.
Making Graphs
Scales
Scales are functions that map from an input domain to an output range
Linear Scales
Linear scales have equal division for equal values. We input a svg to grid and scale it down to fit the demensions so it doesn't run off the screen. Consider the following:
const y = d3.scaleLinear()
	.domain([0, 828])
    .range([0, 400])

console.log(y(100)) // 48.3
console.log(y(828)) // 400
console.log(y(414)) // 200

console.log(y.invert(48.3)) // 100
console.log(y.invert(400)) // 414
console.log(y.invert(200)) // 428
One of the most common types of linear scales is a time scale. The input is a JS Date Object and the output is a number. Keep in mind months are indexed starting at 0.
const x = d3.scaleTime()
	.domain([
    		new Date(2000,0,1),
            new Date(2001, 0, 1)
            ])
            .range([0, 400])


console.log(x(new Date(2000, 7, 1)) // 199

console.log(x.invert(199)) // Tue Aug 01 2000
Logaritmic Scales for Diverging Data
Often data sets that grow over time will grow exponentially, such as population. In these cases we would need to use a log scale.
Performing a log scale on a dataset will change the difference between points in a data set to be even (linear).
Remember: You cannot take the log of 0. So never use log on a dataset where the domain passes through 0.
Consider the following:
const y = d3.scaleLog()
	.domain([300, 1500000])
    	.range([0, 400])
        .base(10)

console.log(y(500)) // 32.9
console.log(y(5000)) // 181.1
console.log(y(50000)) // 329.3

console.log(y.invert(32.9)) // 500
console.log(y.invert(181.1)) // 5000
console.log(y.invert(329.3)) // 50000
Ordinal Scales
For assigning color schemes to categorical data. If there are more items in the domain than the range then the array loops back around from the start. There are also pre-build color schemes. 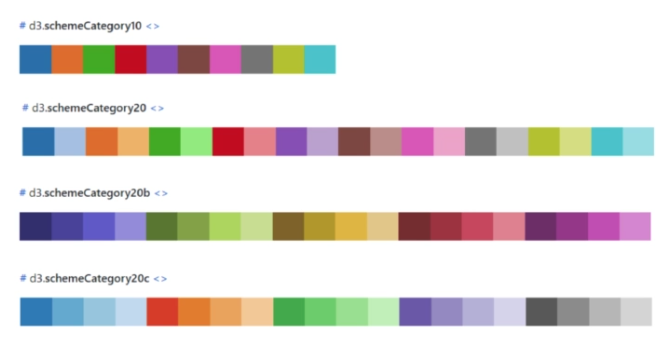
const color = d3.scaleOrdinal()
	.domain([
    	"AFRICA", "ASIA"
    ])

    .range([
    	"RED", "BLUE", "GREEN"
    ])
    // Alternatively
    //.range(d3.schemeCategory10)


console.log("AFRICA") // "RED"
console.log("ASIA") // "BLUE"
console.log("EUROPE") // "GREEN"
console.log("PANGEA") // "RED"
It is not possible to take the invert of a ordinal scale.
Band Scales
Discrete Domain, Continous Range Band scale are almost exlusively used to space out different categories in a bar chart. The scale splits up the range into bands of equal length based on the number of elements in the array. 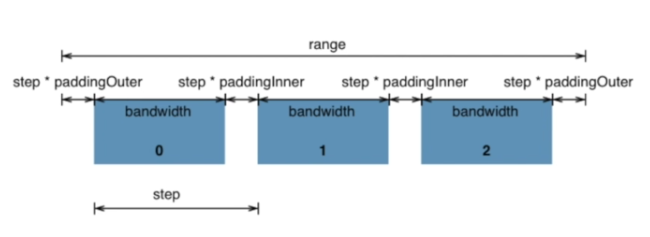
We give the scale an array of categories as a domain and a min and max values for the range. Also a ratio between 0 and 1 for the inner and outer padding needs to be provided, which defines how thick the bars should be. A padding ratio of 0 means no spacing between bars.
If we call a value that doesn't exist in the domain the scale returns undefined.
const x = d3.scaleBand()
	.domain([
    	"AFRICA", "N. AMERICA",
        "EUROPE", "S. AMERICA",
        "ASIA", "AUSTRALIA"
	 ])
     .range([0, 400])
     .paddingInner(0.3)
     .paddingOuter(0.2)

console.log(x("S. AMERICA")) // 209
console.log(x("AUSTRALASIA")) // 341
console.log(x("AFRICA")) // 13.1

console.log(x.bandwidth()) // 45.9
Determine Min and Max
Rather than defining range and domain as static values, D3 has a few functions to determine these automatically; min, max and extent. They all work generally the same, they take an array of data and an access function as arguments. The accessor function loops over every item in an array.
const data = [
	{ grade: "A", value: 4 },
    { grade: "C" , value: 1}
]

const min = d3.min(data, d => d.value) // 1
const max = d3.max(data, d => d.value) // 4
const extent = d3.extent(data, d => d.value) // [1, 4]
const grades = data.map(d => d.grade) // ["A", "C"]
Margins and Groups
We usually define a margin to surround the visualization using D3 axis generators to add padding to the top, left, bottom, or right. Also we can tweak the dimensions of our visualizations directly from within our javaScript.
This is done by attaching everything to an SVG Group Element, which we can translate anywhere on the canvas. SVG group elements are containers for different SVG shapes. Basically we can bundle many shapes together and translate and transform each using ES6 functions.
const MARGIN = { LEFT: 100, RIGHT: 10, TOP: 10, BOTTOM: 130 }

// The example canvas below is 600x400
// but we deduct the margins
const WIDTH = 600 - MARGIN.LEFT - MARGIN.RIGHT
const HEIGHT = 400 - MARGIN.TOP - MARGIN.BOTTOM

const svg = d3.select("#chart-area").append("svg")
  .attr("width", WIDTH + MARGIN.LEFT + MARGIN.RIGHT)
  .attr("height", HEIGHT + MARGIN.TOP + MARGIN.BOTTOM)

// From here we can append shapes to group element g
const g = svg.append("g")
  .attr("transform", `translate(${MARGIN.LEFT}, ${MARGIN.TOP})`)

const rectangles = g.selectAll("rect")
 .append("rect")
 ...
Axes and Labels
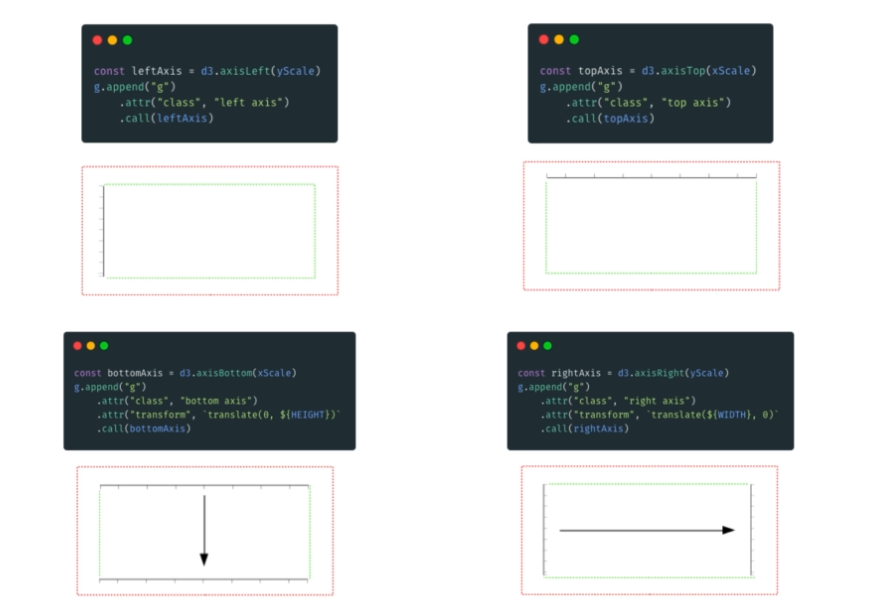
Axis are generated from the origin point, meaning axises not on the left or top need to be attached to a group and translated.
We can change the distance between ticks using the following methods:
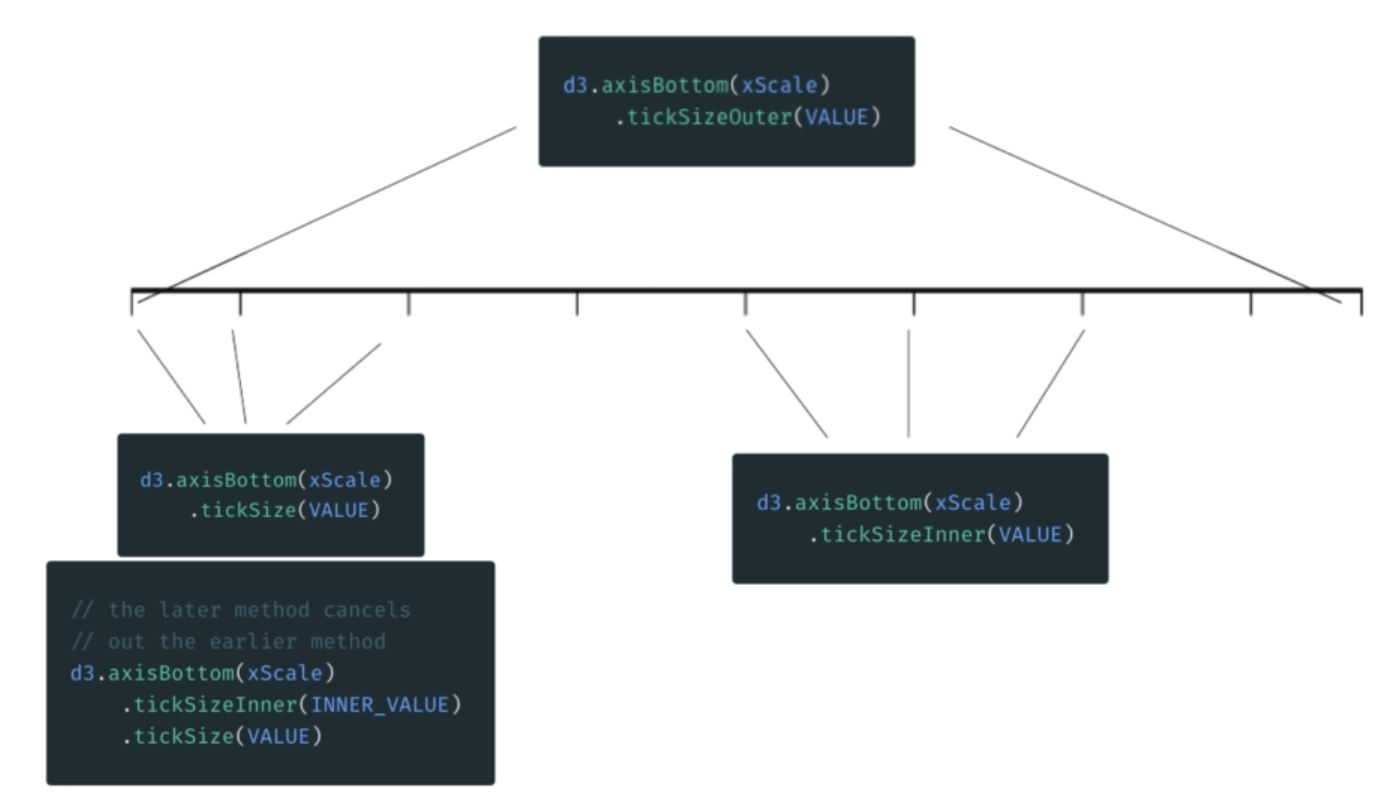
tickSizeOuter only changes outermost ticks, tickSizeInner only changes inner ticks, tickSize effects all of them equally. Using tickSize along with the inner or outer adjuster will make the last one called count.
// How Many?
d3.axisBottom(xScale)
	.ticks(10)

// Text format
d3.axisBottom(xScale)
	.ticketFormat(d3.format(",.0f")

// Explicit Values
d3.axisBottom(xScale)
	.tickVlues([1, 2, 5, 6])
Line Graphs
Recall how svg paths work from the previous section, how we provide a list of coordinates to the path tag in HTML to create a line. D3 comes with path generators that we can use to create lines.
// line path generator
const line = d3.line()
	.x(d => x(d.year))
	.y(d => y(d.value))

// add line to chart
g.append("path")
	.attr("class", "line")
	.attr("fill", "none")
	.attr("stroke", "grey")
	.attr("stroke-width", "3px")
	.attr("d", line(data))
The Basics of Design
Data visualizations should be easy to interpret and look credible. To do this there are several factors that be kept in focus, called Edward Tufte's Six Design Principals of Graphical Integrity[1]:
- The representation of numbers on the graphic should be proportional to the numerical quantities measured
- Clear detailed labels should be used to defeat ambiguity. Write out explanations of the data and label important events.
- Show data variation, not design variation
- In time-series displays of money, deflated and standardized units of monetary measurement are nearly always better than nominal units.
- The number of information carrying variables should not exceed the number of observations in the data
- Graphics should not quote data out of context
These are guidelines rather than hard rules. Some argue 'chart junk' (unnecessary visual elements that do not contribute to the information presented) is not always a bad thing. Sometimes grabbing the attention of the reader is important. When critiquing a visualization address the following questions:
- What is the visualization trying to do?
- Does this visualization contain a lie factor? Or is misleading?
- How high is the data-ink ratio?
- How would you rank the visualization on a scale of 1-10?
The Design Toolkit
The three types of data are quantitative (numerical), categorical, and ordinal (ranking). There are many different ways of representing each type of data but some require more brainpower to figure out than others.
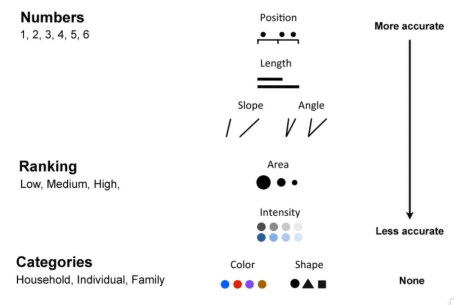
- Typical position and length are best for representing quantitative data
- For ranked data area is the best representation
- Categorical is best represented by shape or color to illustrate that each category is distinctly different.
- Never use more than 5-8 colors for categories, else-wise colors overlap
- Consider that 5% of the population is colorblind.
ColorBrewer is an excellent tools for choosing color schemes for scales.
Sketches
Sketchs are quick and easy drafts that let you test how things should look before getting into the coding. It allows us to communicate design ideas while exploring the data. Here are three general guidelines:
- Sketches should be on paper, big enough to see everything clearly
- Get the general point across, don't worry about the details
It's easy to get stuck only thinking in terms of pie charts, histograms, bar charts, and line graphs. Try new things and be creative!
Bootstrap Grid System
Structuring pages for responsive visualization is much easier using the bootstrap grid system. To set it up every element needs to be surrounded by a div container. Bootstrap sizes divs according to their class, ex. 'row' creates rows on the page.
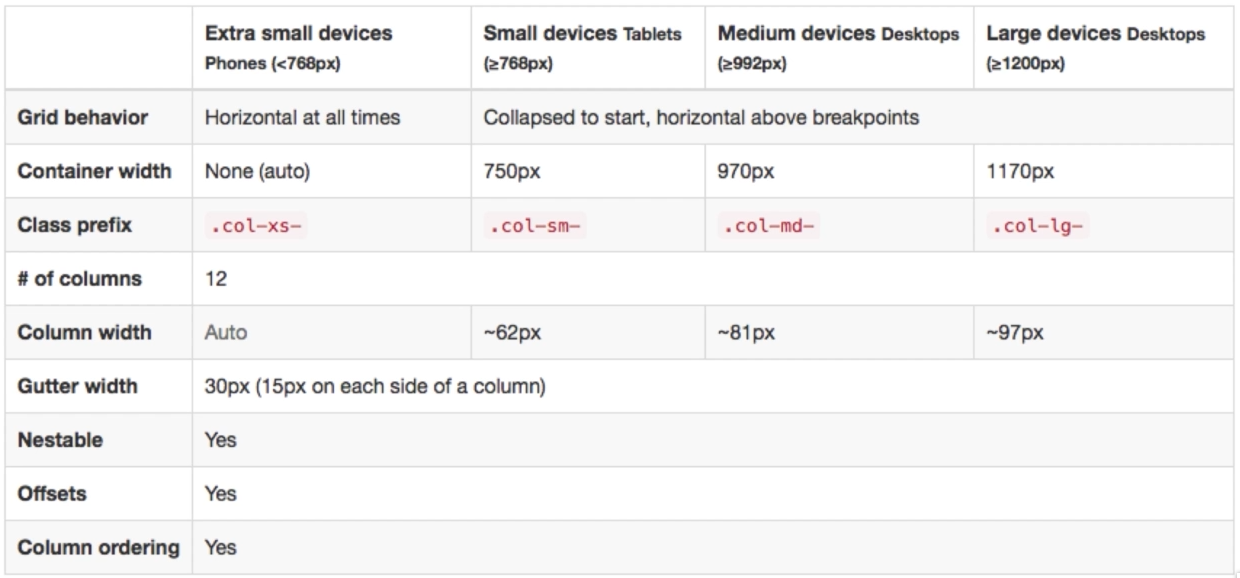
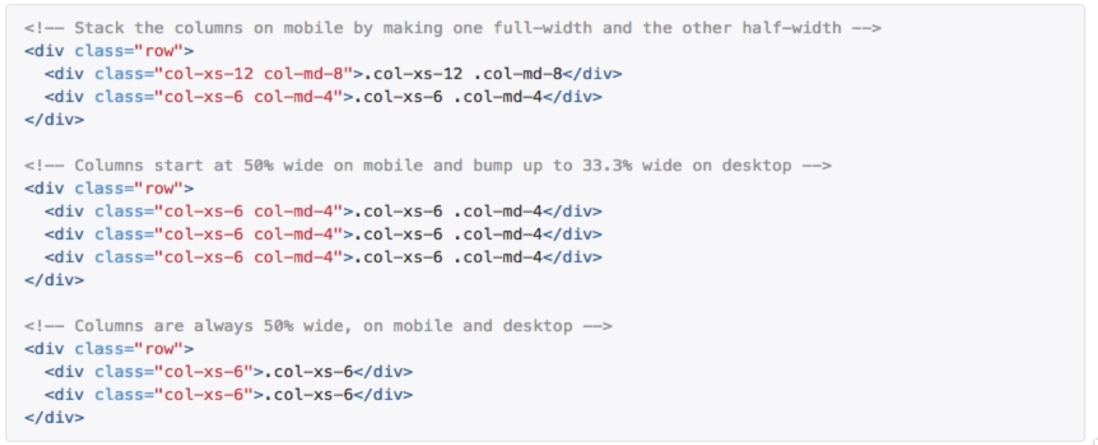
A page is always 12 columns across. Within a row we might put multiple class tags so the columns add up to different values on mobile vs desktop. Using col-xx-offset creates invisible spaces which offset columns.
[1] Edward Tufte is a Statistician and Professor at Yale University. The six design principals come from his book The Visual Display of Quantitative Information.
Dynamic and Interactive Content
Thus far we've looked at building static content, but the backbone of D3.js are it's beautiful transitions and dynamic updating capabilities.
Intervals
We need some way of repeatedly running code to change something the chart reacts to. The easiest way to do this in d3 is using an interval.
const myInterval = d3.interval(() -> {
 	// code to loop
}, 500) //runs every 500ms

clearInterval(myInterval) // stop loop
The D3 Update Pattern
Let's debug the following code to observe how D3 objects work:
// JOIN data to create d3 virtual selectors
const rects = g.selectAll("rect")
      .data(data)

console.log(rects)

// EXIT - Old Elements
rects.exit().remove();

// ENTER - new elements onto the page
rects.enter().append("rect")
      .attr("y", d => y(d.revenue))
      .attr("x", (d) => x(d.month))
      .attr("width", x.bandwidth)
      .attr("height", d => HEIGHT - y(d.revenue))
      .attr("fill", "grey")

// UPDATE as needed
rects.attr("fill", "blue")

console.log(rects)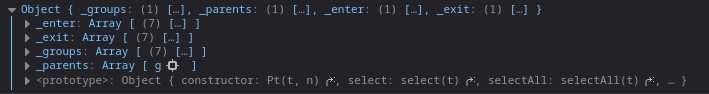
We now have an object with _enter, _exit, _groups and _parents. _enter contains elements in our data array that don't exist on the page (the shapes that need to be 'entered' on the screen). _exit is elements that are on the page but not in our data array (elements to be removed from the screen). _groups represents all elements that exist on the screen.
We always want to use the same update pattern when our data changes:
- Data Join - select all matching elements on the screen with selectAll() and update the data we're using
- Exit - Use the exit() selector to remove the elements that don't exist in our new array of data
- Update - set attributes for existing elements on screen
- Enter - use the enter() selector to set attributes for new items in our data array
Transitions
To give smooth updates, we can use the d3 transition suite. Which can be added with the following line:
rects.enter().append("rect")
      .attr("x", (d) => x(d.month))
      .attr("width", x.bandwidth)
      .attr("height", d => HEIGHT - y(d.revenue))
      .attr("fill", "grey")
      .transition(d3.transition().duration(500)) // gradually apply over 500ms
        .attr("y", d => y(d[value]))
Transitions are applied over time to each dynamic element of the graph. We can also define the transition as a variable so we don't have to write out d3.transition() over again. Always keep the transition length smaller than the loop's delay.
We can make the transitions even smoother by adding a exit transition and specifying the initial values before the transitions.
update(data) {
  ...

  const t = d3.transition().duration(500)

  rects.exit()
      .attr("fill", "red")
      .transition(t)
      .attr("height", 0)
      .attr("y", y(0))
      .remove()

  rects.transition(t)
      .attr("y", d => y(d[value]))
      .attr("x", (d) => x(d.month))
      .attr("width", x.bandwidth)
      .attr("width", x.bandwidth)
      .attr("height", d => HEIGHT - y(d[value]))

  rects.enter().append("rect")
      .attr("x", (d) => x(d.month))
      .attr("width", x.bandwidth)
      .attr("height", d => HEIGHT - y(d[value]))
      .attr("fill", "grey")
      .attr("fill-opacity", 1)
      .attr("y", y(0)) // Starting y axis
      .attr("height", 0) // Starting height
      .transition(t)
        .attr("y", d => y(d[value]))
        .attr("height", d => HEIGHT - y(d[value]))
}
D3 Merge Method
You'll notice in the last code chunk the update and enter statement are somewhat repetitive. This can be resolved with the merge method.
  rects.exit()
      .attr("fill", "red")
      .transition(t)
      .attr("height", 0)
      .attr("y", y(0))
      .remove()

  rects.enter().append("rect")
      .attr("fill-opacity", 1)
      .attr("y", y(0))
      .attr("height", 0)
      // UPDATE is now part of transition
      .merge(rects)
      .transition(t)
        .attr("width", x.bandwidth)
        .attr("fill", "grey")
        .attr("x", (d) => x(d.month))
        .attr("y", d => y(d[value]))
        .attr("height", d => HEIGHT - y(d[value]))
By default, d3 assumes the elements between data arrays stay in order. Let's say the first dataset is missing the first element, to resolve this we can add an argument to the data function to choose a key between different arrays.
A Note of .attr vs .style
	legendRow.append("text")
    .attr("x", -10)
    .attr("y", 10)
    .attr("text-anchor", "end")
    .style("text-transform", "capitalize")
    .text(continent)
The style method is used to set css styles of svgs. Sometimes styles can also be attributes, such as fill, capacity, stroke width. Sometimes they can be use interchangeably but in cases like text-transform .style must be used.
D3 Formats and Parsing
d3.format(".0%")(0.123);  // rounded percentage, "12%"
d3.format("($.2f")(-3.5); // localized fixed-point currency, "(£3.50)"
d3.format("+20")(42);     // space-filled and signed, "                 +42"
d3.format(".^20")(42);    // dot-filled and centered, ".........42........."
d3.format(".2s")(42e6);   // SI-prefix with two significant digits, "42M"
d3.format("#x")(48879);   // prefixed lowercase hexadecimal, "0xbeef"
d3.format(",.2r")(4223);  // grouped thousands with two significant digits, "4,200"

const formatter = d3.format(".2f")

formatter(1000) // 1000.00
formatter(5.248) // 5.25
formatter(30.1) // 30.10
We can define a format and call as a function to return more human readable numbers. We can even add custom specifiers to specify sign, symbol, commas, and precision. The full list of rules can be found here. There are separate methods formatTime and parseTime to work with times.
Tool Tips
Tooltips were added by a member of the D3 community in the d3-tip library. The library needs to be installed separately. It can be used to let the user view the data within an SVG. They are implemented as follows:
- Initialize the tooltip element
Create the tip, assign a class for styling, and then setting the content of the tooltip with the html function.tip = d3.tip().attr('class', 'd3-tip').html(function(d) {return d;}); - Invoking the tip in the context of the visualization
Let the page know we want to attach the tooltip to the svg area.vis.call(tip) - Adding Event Listeners and Handlers
The 'on' method is used to attach events to SVGs. The two arguments are the type of event and function to execute.vis.selectAll('rect') .data(data) .enter() .append('rect') .attr('width', function { return x.rangeBand() }) ... .on('mouseover', tip.show) .on('mouseover', tip.hide)
The alternative is adding the tooltip as a div:
var tooltip = d3.select("body")
    .append("div")
    .style("position", "absolute")
    .style("z-index", "10")
    .style("visibility", "hidden")
    .style("background", "#000")
    .text("a simple tooltip");

d3.select("body")
  .selectAll("div")
    .data(data)
  .enter().append("div")
    .style("width", function(d) { return x(d) + "px"; })
    .text(function(d) { return d; })
    .on("mouseover", function(d){tooltip.text(d); return tooltip.style("visibility", "visible");})
      .on("mousemove", function(){return tooltip.style("top", (d3.event.pageY-10)+"px").style("left",(d3.event.pageX+10)+"px");})
      .on("mouseout", function(){return tooltip.style("visibility", "hidden");});
Event Handlers and Listeners
For making our visualizations more interactive we can add event handlers to the svg. The following code utilizes the jQuery to select items from the screen and add the event handler. The slider requires the separate jQuery UI package.
<button id="reset-button" class="btn btn-primary">Reset</button>
<div id="slider-div">
	<label>Year: <span id="year">1800</span></label>
	<div id="date-slider"></div>
</div>
// jQuery
$("#reset-button")
.on("click", () => {
currentYear = 1800
update()
})
// jQuery UI
$("#date-slider").slider({
min: 1800,
max: 2014,
step: 1,
slide: (event, ui) => {
currentYear = ui.value
update()
}
})Since D3 is a JS library, we could combine it with a framework instead of jQeury to meet the same results. D3 can be easily integrated into Angular or React web apps. It can also work in tandem with statistical programming languages like Python and R (with R Shiny).
Layouts and Structured Data
Now that I've covered the basics of programming in D3, let's take a look at some of the other cool things one can build with D3. Before jumping into the code, it's worth mentioning the resources available within the D3 community for sharing reusable code. As of writing this there are sites like VisHub or the D3 Graph Gallery which contain some commonly used D3 code snippets.
Also, this guide mostly follows version 7 as it is the latest . Sometimes libraries are slow to update documentation examples so it is important to read the change log when trying to upgrade D3.
Layouts
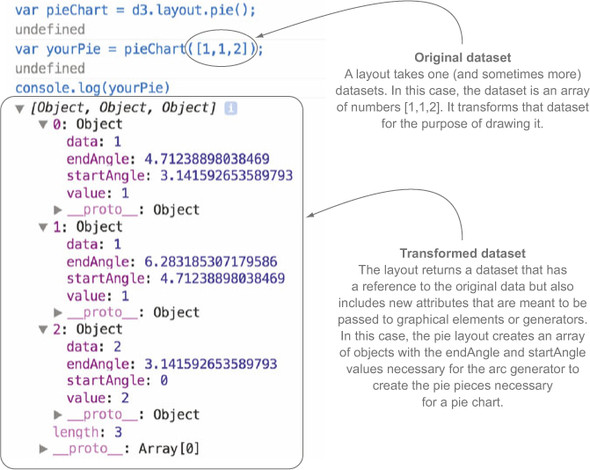
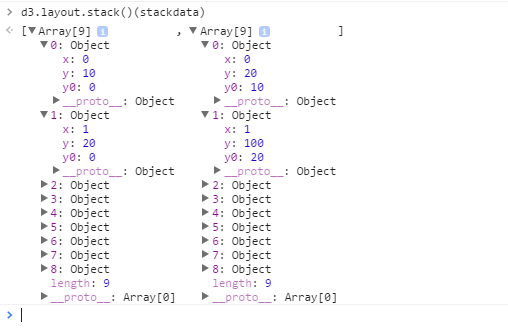
Layout functions format the data to include attributes that allow for drawing the data.
I found the below visualizations here and here, but note it uses D3 v3 syntax, for v4+ we would just use d3.pie() rather than d3.layout.pie()
Other layouts include:
- d3.force() - Nodes are represented as circles and edges/link/connections as lines (more on this below)


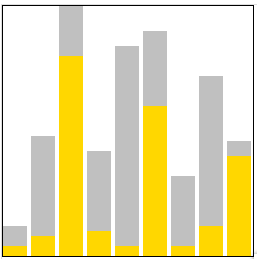
- d3.stack() - Good for illustrating how ratios compare over time


Choosing the Right Data Structure
There are cases where the above functions expect data in a certain format, that being either an Array or Object (map).
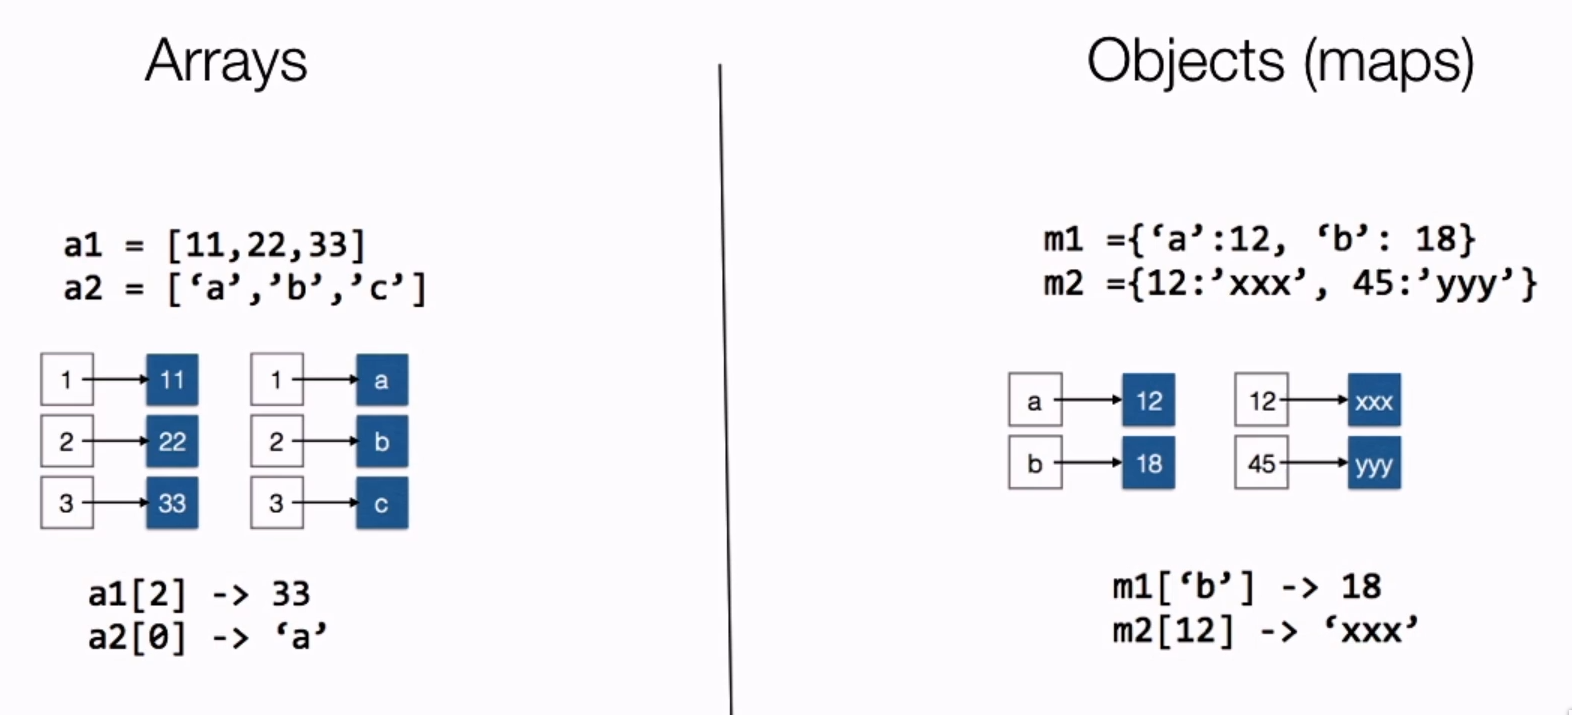
The advantage with Maps is we can find a key without the index or searching the entire data structure. In D3 we often work with Arrays of objects, which is good for looping over objects but can make searching for a field within an object cumbersome. The D3 group(), or groups() function (previously known as nest()) can create a map of JS objects based on a category.
Maps
The first step towards creating a visualization of a region is finding the map file to use, containing information about borders and locations. There several places online that can create files for this purpose, the most popular format being GeoJSON and D3.geoPath(). Another format is TopoJSON which also encodes topology, and are usually smaller than GeoJSON even though they include more data.
When building maps converting a sphere to a 2D surface can be problematic. To get the map to fit nicely to the screen we often apply some kind of projection that stretches the areas nearer to the poles, making them appear larger than they actually are. In D3 we have the flexibility to choose the projection we want to use with our maps.
    var width = 600,
        height = 400;

    var projection = d3.geoConicEqualArea()
        .scale(153) // How much to zoom in
        .translate([width / 2, height / 2]) // Center the map
        .precision(.1);

    var path = d3.geoPath()
        .projection(projection); // Define the path and attach projection

    var graticule = d3.geoGraticule(); // The coordinate lines on the map

    var svg = d3.select("body").append("svg")
        .attr("width", width)
        .attr("height", height);

   d3.json("data/world-110m.json").then(function(world) {

        svg.append("path")
     		// Land borders for the map
            .datum(topojson.feature(world, world.objects.land))
            .attr("class", "land")
            .attr("d", path);

        svg.append("path")
     		// Define borders between countries
            .datum(topojson.mesh(world, world.objects.countries, function(a, b) { return a !== b; }))
            .attr("class", "boundary")
            .attr("d", path);

        svg.append("path")
            .datum(graticule)
            .attr("class", "graticule")
            .attr("d", path);
    });

    d3.select(self.frameElement).style("height", height + "px");
So in the above I use d3.geoConicEqualArea() to get a cone shaped map with actual sizes, the typical projection of the standard classroom world map would be geoMercator() instead. Also, do not use these options if the map data already has a projection.
Loading Multiple Datasets
So now we know how to load map data, but we'll need to load another file with regional information to create useful visualizations. To do this we will learn about Queues (D3 < v5) and Promises (D3 v5+).
Let's say we have a JSON and a csv to load. We might be tempted to write two different data statements or nest them together. Here's the issue:
// METHOD 1 - With a global variable (WRONG)

var mapData, infoData; // Global variables

// Async data loading for json
d3.json("map.json", function(map){
	mapData = map;
})
// Async data loading for csv
d3.csv("info.csv", function(info){
	infoData = info;
})

// Code here to do something with the data
// ISSUE: This gets run immediately even if the above datasets are not initialized

// METHOD 2 - Nested data statements (WRONG)

d3.json("map.json", function(map){
  d3.csv("info.csv", function(info){
      // Code here to do something with the data
  })
})

// ISSUE: This works, but takes a long time bc the page can't start loading the 2nd file before the 1st is done
Now the correct method:
// D3 Queue < V5
d3.queue()
	.defer(d3.json, "map.json")
	.defer(d3.json, "info.csv")
	.await(function(map, info) {
		// Code to do something with both files
     });

// Promises - V5+
var promises = [
 	d3.json("map.json"),
  	d3.csv("info.csv")
]

Promises.all(promises).then(function(allData) {
  var map = allData[0];
  var info = allData[1];
  // Code to do something with both files
}).catch(function(error) {
  console.log(error);
});
Networks
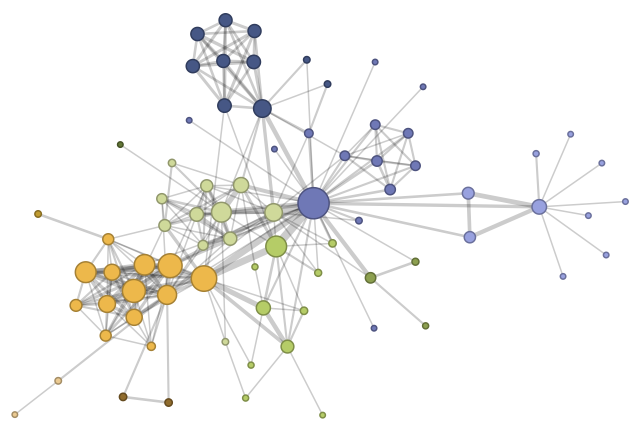
The d3.force layout allows us to create a physics simulator with elements that attract and repel each other. These are good for visualization relationships between elements and grouping elements around a central point.
There is a general process to follow when creating a visualization with d3.force:
- Initialize the force simulation
- Add force functions to the system
- Create a callback function to update SVG positions after every "tick"'
// Add "forces" to the simulation
var simulation = d3.forceSimulation()
// Define center of gravity
.force("center", d3.forceCenter(width / 2, height / 2))
// Making elements attract or repel
.force("charge", d3.forceManyBody().strength(-50))
// Prevent elements from overlapping
.force("collide", d3.forceCollide(10))
// Creates fixed distance between connected elements
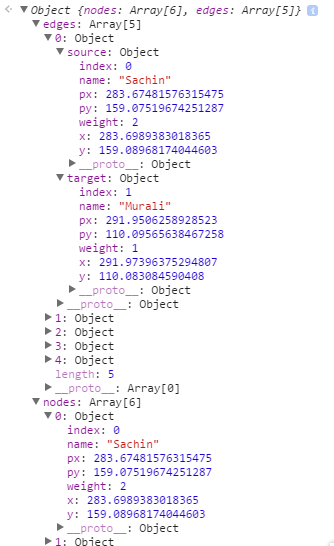
.force("link", d3.forceLink().id(function(d) { return d.id; }))
// Data elements
.nodes(graph.nodes)
.on("tick", ticked);
// Fire on every tick of the clock to update
function ticked() {
link
.attr("x1", function(d) { return d.source.x; })
.attr("y1", function(d) { return d.source.y; })
.attr("x2", function(d) { return d.target.x; })
.attr("y2", function(d) { return d.target.y; });
node
.attr("transform", d => `translate(${d.x}, ${d.y})`);
}These graphs are fun way to illustrate relationships between a network while also facilitating user engagement.
Hierarchical Data
Now let's consider data that belongs to a system in which elements belong to other elements, such as a typical corporate hierarchy from CEO down. There's a lot of synonymous terminology that can be used with tree charts, here is what we'll be using:
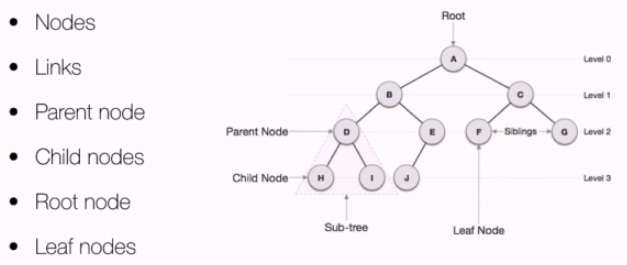
Our data must have a "root" node in the right format; d3.hierarchy or d3.stratify can be used to convert a JS Object. Using hierarchy, every node and descendant must have the following properties:
- node.data - the associated data as passed to hierarchy
- node.depth - zero for the root, increasing by one for each descendant generation
- node.height - the greatest distance from any descendant leaf, or zero for leaves
- node.parent - the parent node, or null for the root node
- node.children - an array of child nodes, if any, or undefined for leaves
- node.value - the optional summed value of the node and its descendants
If there is no existing structure to the data we can use stratify to define it:
const root = d3.stratify()
    .id((d) => d.name)
    .parentId((d) => d.parent)
  (table);
Once we have the data in the proper format we can represent the data as:
- Tree Diagram/Map
- Packed cirlces
- Sunburst charts
d3InDepth has a great section on this
File Structure and Linked Views
After adding a lot of different event listeners, the JavaScript file can become messy. This section focuses on writing readable code in an 'Object Oriented' way for larger projects (but OOP will not be covered in depth here). Once a class is set up for a visualization, it can be easily reused.
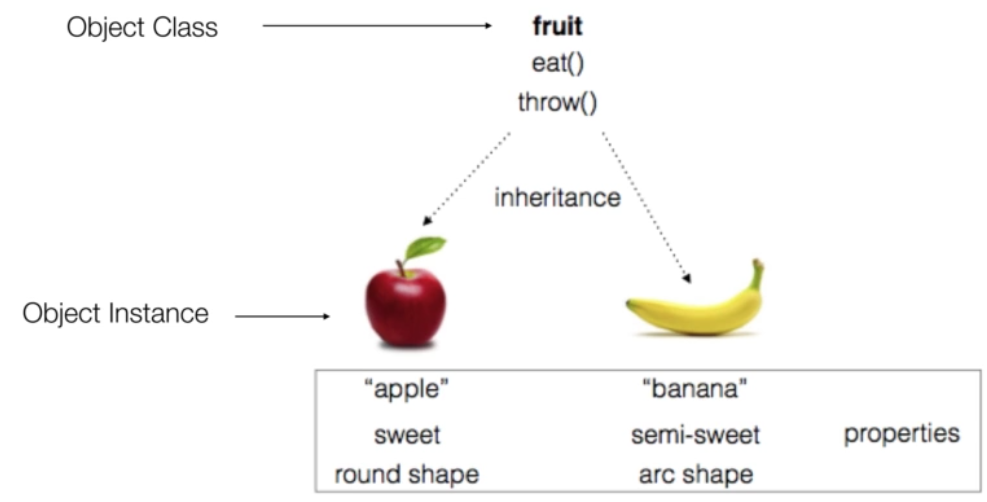
The idea to have a main JS file and then a separate file for each visualization as a class. Keep in mind file order matters when loading scripts in HTML, so the main file should be loaded last.
I'm going to write the following examples in JavaScript ES6+, but TypeScript will also work. The big difference is JavaScript only supports local and global objects, while TypeScript's classes are more akin to a language like Java.
// from barChart.js
class BarChart{
    constructor(_parentElement, data) {
        this.parentElement = _parentElement
        this.data = _data
    }

    // class method
    initVis() {
        const vis = this
        vis.WIDTH = 250
        vis.HEIGHT = 100
            ...
    }
}

// from main.js
const barChart = new BarChart("#bar-chart-area", data) // new class instance
barChart.initVis()
By using an object oriented manner, it it easier to create multiple of the same graphic without duplicating much of the same code, and allows us to create multiple objects that react to a single event.
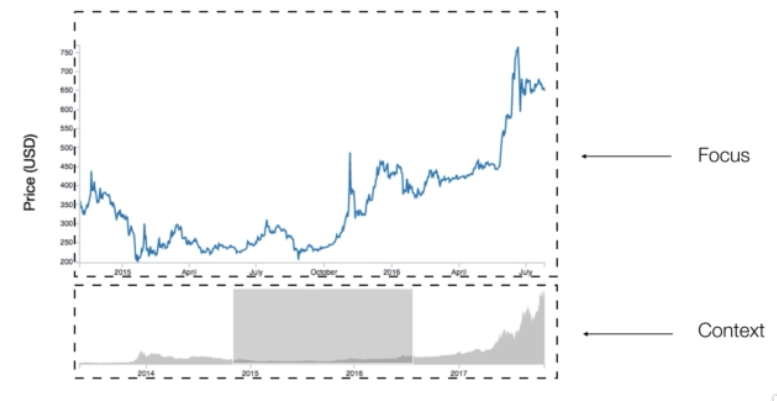
Brushes
D3 Brushes are used for selecting an area of a visualization; For example, adding a context graph beneath our line chart that allows the user to zoom in or out.
There's three steps to adding brush behaviour to an HTML or SVG element:
- call
d3.brush()to create a brush behavior function - add an event handler that's called when a brush event occurs. The event handler receives the brush extent which can then be used to select elements, define a zoom area etc.
- attach the brush behavior to an element(s)
let data = [], width = 600, height = 400, numPoints = 100;

let brush = d3.brush()
	.on('start brush', handleBrush);

let brushExtent;

function handleBrush(e) {
	brushExtent = e.selection;
	update();
}

function initBrush() {
	d3.select('svg g')
		.call(brush);
}

function updateData() {
	data = [];
	for(let i=0; i<numPoints; i++) {
		data.push({
			id: i,
			x: Math.random() * width,
			y: Math.random() * height
		});
	}
}

function isInBrushExtent(d) {
	return brushExtent &&
		d.x >= brushExtent[0][0] &&
		d.x <= brushExtent[1][0] &&
		d.y >= brushExtent[0][1] &&
		d.y <= brushExtent[1][1];
}

function update() {
	d3.select('svg')
		.selectAll('circle')
		.data(data)
		.join('circle')
		.attr('cx', function(d) { return d.x; })
		.attr('cy', function(d) { return d.y; })
		.attr('r', 4)
		.style('fill', function(d) {
			return isInBrushExtent(d) ? 'red' : null;
		});
}

initBrush();
updateData();
update();
For more info check out this d3indepth article on interaction.